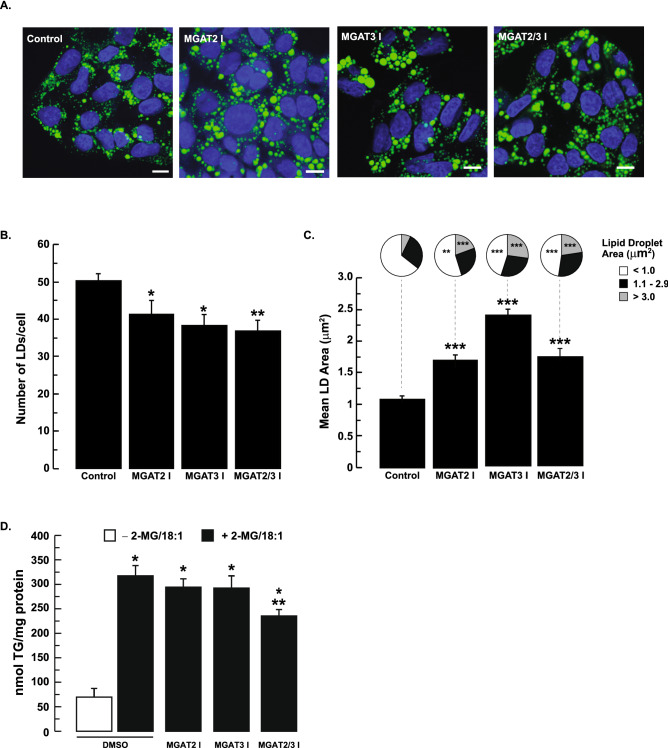
Figure 2.
Inhibition of MGAT2 or MGAT3 alters lipid droplet morphology. (A) HepG2 cells were pre-incubated with 50 µM MGAT2 inhibitor or 100 µM MGAT3 inhibitor or both together for 2 h. Cells were then incubated with 0.5 mM oleic acid and 0.2 mM 2-MG for 12 h in the presence of the MGAT inhibitors. Cells were fixed and stained with Bodipy 493/503 and DAPI to visualize lipid droplets and nuclei, respectively. Scale bars, 10 µm. Lipid droplet number (B) and area (C) were quantified using ImageJ (National Institutes of Health, rsb.info.nih.gov/ij). Mean lipid droplet area per cell and lipid droplet number were calculated from 20 to 29 cells. Data are shown as means ± standard error. Size distribution of individual lipid droplets are shown as pie charts. Means were compared by ANOVA followed by Bonferroni Multiple Comparisons Test. *p < 0.05 versus DMSO-treated cells; **p < 0.01 versus DMSO-treated cells; ***p < 0.001 untreated versus DMSO-treated cells. (D) Intracellular TG levels in HepG2 cells are modestly reduced only when both MGAT2 and MGAT3 are inhibited. HepG2 cells were pre-incubated with the MGAT inhibitors or DMSO for 1 h. This was followed by incubating HepG2 cells with 0.2 mM 2-MG and 0.25 mM oleic acid (OA) in the presence of the MGAT inhibitors for 12 h. Cell extracts were prepared, and an aliquot was used for TG determination. *p < 0.001 versus DMSO-treated cells (without 2-MG/OA); **p < 0.001 versus DMSO-treated cells (with 2-MG/OA).

