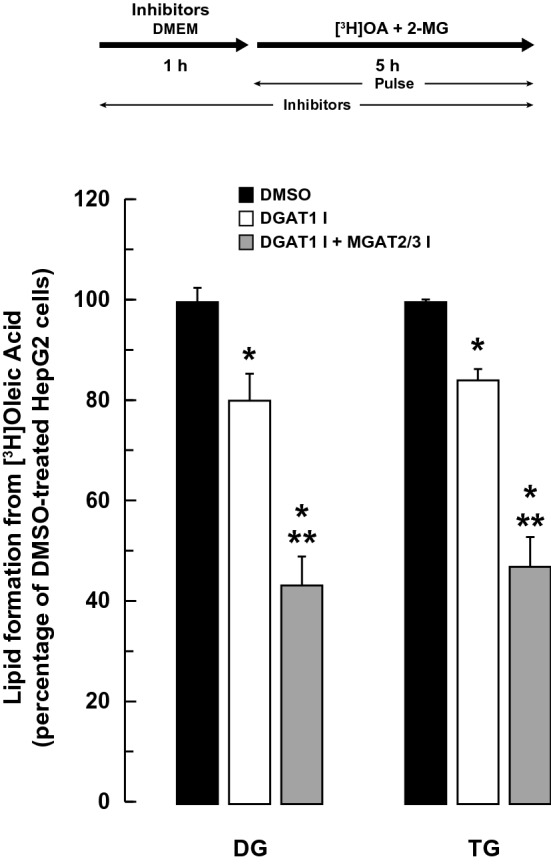
Figure 4.

Effect of DGAT1 inhibition on lipid production from exogenous 2-MG and oleic acid. HepG2 cells were pre-incubated with or without the DGAT1 inhibitor (5 µM) or the DGAT1, MGAT2 (25 µM) and MGAT3 (50 µM) inhibitors together. After 1 h, 5 µCi [3H]OA, cold OA (0.25 mM final concentration) and 2-MG (0.2 mM final concentration) were added to the culture media and cells were incubated for a further 5 h. The incorporation of radioactivity into TG and DG in cells was then determined. Values for DMSO-treated controls: DG (22.3 × 10³ dpm/mg cell protein), TG (421 × 103 dpm/mg cell protein). *p < 0.001 versus DMSO-treated cells; **p < 0.001 DGAT1 inhibitor versus DGAT1, MGAT2 and MGAT3 inhibitors together.
