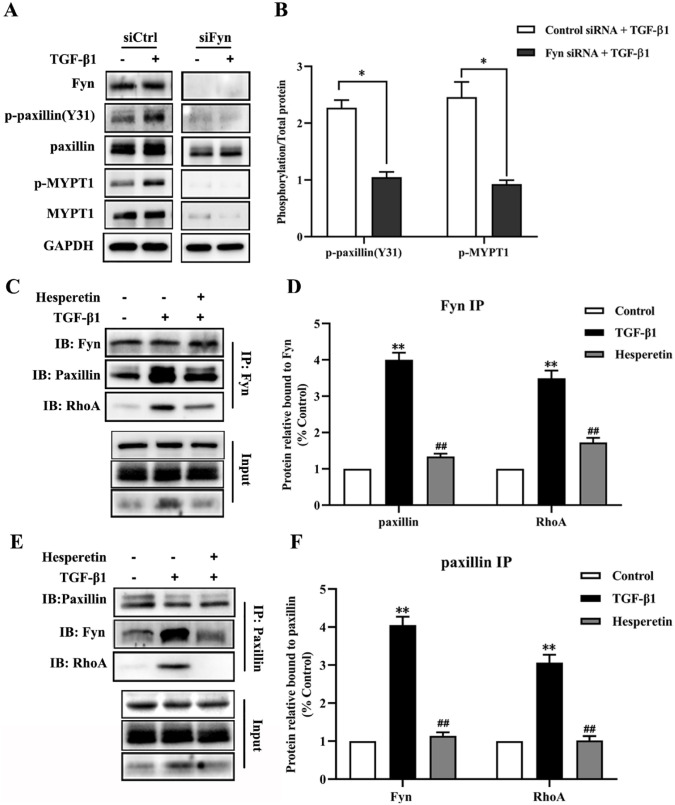
Figure 6.
The interaction between Fyn, paxillin and RhoA and the role of Fyn in paxillin/RhoA pathway. (A) Western blot analysis of lysates from MDA-MB-231 cells transfected with Fyn siRNA or control siRNA with or without TGF-β1 treatment. (B) Quantitative statistical analysis of immunoblots (A) indicates the reduced phosphorylation of paxillin (Y31) and MYPT1 at T853 after knockdown of Fyn. Data are expressed as the mean ± SD, n = 6. *P < 0.01 Fyn siRNA group versus control siRNA group. (C) Immunoprecipitation of Fyn in MDA-MB-231 cells reveals the interaction between Fyn, paxillin and RhoA. (D) Quantitative statistical analysis of immunoblots in (C) shows relative paxillin and RhoA levels after Fyn immunoprecipitation. Data are expressed as the mean ± SD, n = 6. **P < 0.01 versus control group; ## P < 0.01 versus TGF-β1 group. (E) Immunoprecipitation of paxillin in MDA-MB-231 cells reveals the interaction between Fyn, paxillin and RhoA. (F) Quantitative statistical analysis of immunoblots in (E) shows relative Fyn and RhoA levels after paxillin immunoprecipitation. Data are expressed as the mean ± SD, n = 6. **P < 0.01 versus control group; ##P < 0.01 versus TGF-β1 group.

