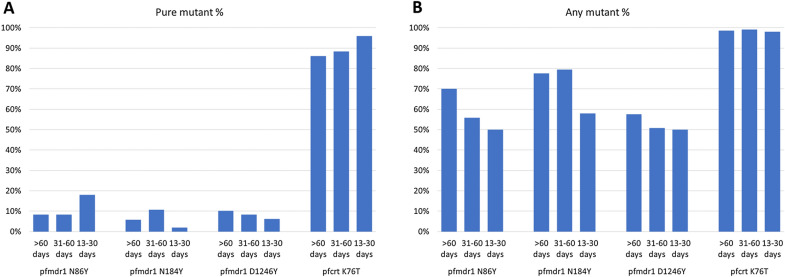
Fig. 3.
Re-analysis of data purportedly showing selection of resistance markers by monthly seasonal malaria chemoprevention in school-age Ugandan children. For each resistance marker, the three bars represent proportion of infections containing mutant genotypes at increasingly distant times from last drug treatment with Dihydroartemisinin-piperaquine. Panel A shows the original analysis, depicted here in graph form, and showing apparent selection of “pure mutant” genotypes of pfmdr1 N86Y and pfcrt K76T based on their increasing in prevalence after drug treatment. Panel B depicts a re-analysis of the same data showing no evidence of positive selection for mutant genotypes when all infections containing the mutation in question are considered to have resistant parasites. Data from Nankabirwa et al. Antimicrob Agents Chemother 2016, 60:5649–54

