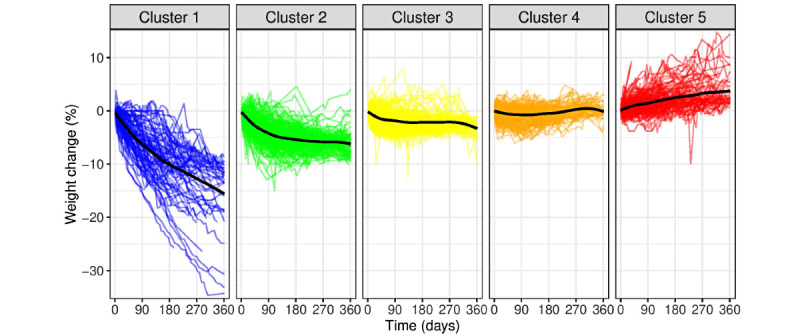
Figure 3.

Clusters of study participants (N=1189) based on weight loss success trajectories. Individual weight loss patterns were clustered based on dynamic time-warping distance and agglomerative hierarchical clustering. Each colored line represents the weight change trajectory of a participant. The black line represents the average weight change in said cluster. Cluster 1, superresponders; cluster 2, responders; cluster 3, moderate responders; cluster 4, nonresponders; cluster 5, gainers.
