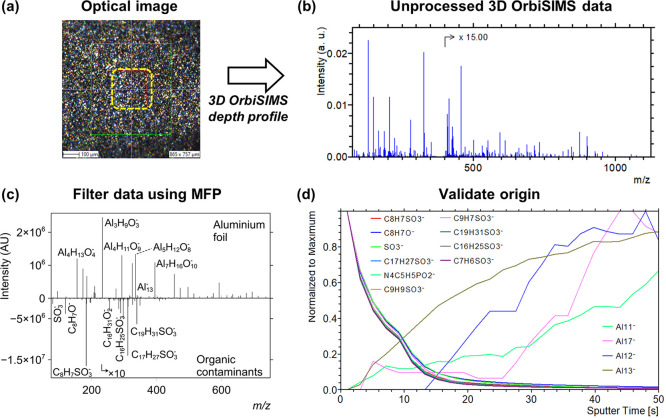
Figure 1.
Separating organic and inorganic species on aluminum foil 3D OrbiSIMS depth profiling datasets using MFP. (a) Optical image of the analysis area before Ar3000+ depth profiling. (b) Raw depth profile accumulation spectra in the negative ion mode. (c) Positive scale, plots of the inorganic species containing Al, O, and H identified using MFP. Negative scale, contaminants identified after performing a repeated mass separation of the initial dataset, followed by another formula filtering iteration analysis to identify species with C, H, O, N, S, and P (intensity × −1). (d) Depth profiles of some species in each sub-group. MFP, molecular formula prediction.

