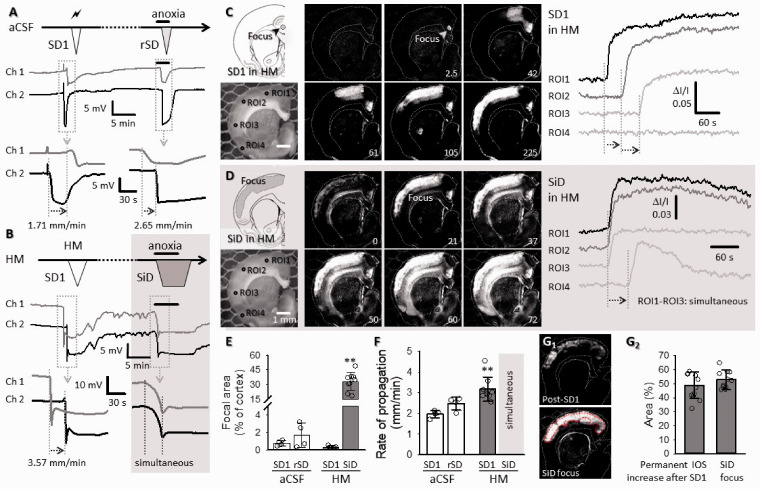
Figure 2.
Replication of SD and SiD during osmotic stress in rat ex vivo coronal brain slice preparations. (a) The regular spreading nature of both SD1 and rSD in normal aCSF is shown in a representative electrophysiology experiment. SD1 was elicited by electrical stimulation and rSD was induced by transient anoxia (oxygen withdrawal of 2.5. min). (b) SD1 occurred spontaneously to HM exposure (HM60 here), while the subsequent event was induced 15 min later by transient anoxia. The original electrophysiological recordings demonstrate that SD1 was a spreading event, followed by an SiD in response to anoxia. (c and d) In background subtracted IOS images of a HM-incubated brain slice, the temporal characteristics of SD1 (c) reveal a punctual focus and propagation in the upper cortical layers. (d) Subsequent anoxia in HM (HM100 here) induced SiD of an extensive bulk of cortical tissue (ROI1-ROI3; SiD), and the propagation of the event towards the ventral tips of the cortex (ROI3 → ROI4). Note the simultaneous increase of signal intensity (Panel D) at ROI1-ROI3, and the delay at ROI4 with respect to ROI1. (e) The relative size of the focal area of SD/SiD measured in IOS images. (f) The focal area of SiD incorporated the tissue zone characterized by sustained IOS intensity elevation following SD1. Images in F1 were taken prior to SiD (post-SD1), and at the emergence of SiD (SiD focus). A red broken line delineates the post-SD1 high IOS intensity zone (the later SiD focus). The mean size of the tissue area is given in F2 relative to the full size of the cortex. (g) The rate of propagation of depolarization events. (e to g) Data are given as mean ± stdev, individual values are shown with a dot plot. A Shapiro-Wilk test of normality indicated normal non-normal distribution for (e and f) (p = 0.050*), and normal distribution for Panel G2 (p = 0.304). Accordingly, data in (e and f) were analyzed with a non-parametric Kruskal-Wallis test, followed by a Dunn post hoc analysis (E, p < 0.01** vs. SD1 in HM; F, p < 0.01** vs. SD1 in aCSF). Data in (G2) were evaluated with a one-way ANOVA paradigm, followed by a Sidak post hoc test whenever relevant (p < 0.05*p < 0.01**).

