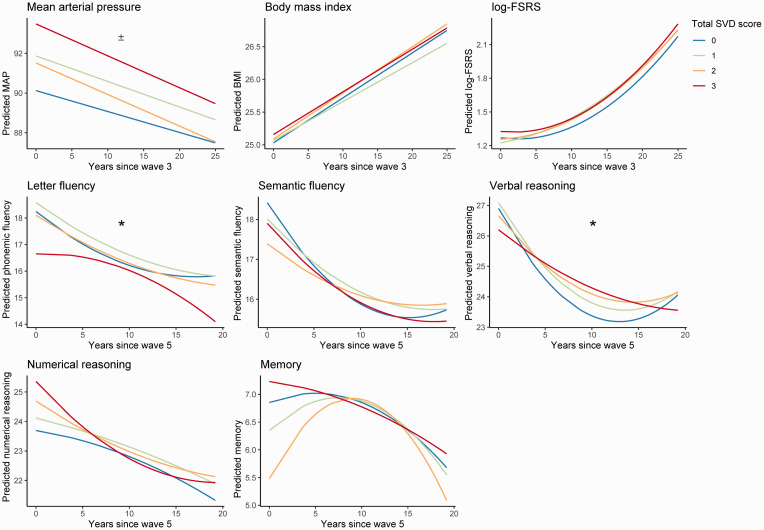
Figure 1.
Predicted longitudinal trajectories for vascular risk and cognitive performance. Each figure depicts the predicted trajectories of the dependent variable of interest based on the linear mixed effect models. Measures for mean arterial pressure (MAP) and log-Framingham stroke risk score (log-FSRS) were obtained between 1995 and 2016. Measures on cognitive performance were obtained between 1997 and 2016. ± indicates significant main effects of SVD burden, where group 3 had higher baseline values compared to group 0 (p < 0.05). * indicates significant interactions where SVD burden group 3 showed steeper rates of cognitive decline compared to group 0 (p < 0.05). MAP: mean arterial pressure.
BMI: body mass index; FSRS: Framingham Stroke Risk Score; SVD: cerebral small vessel disease.

