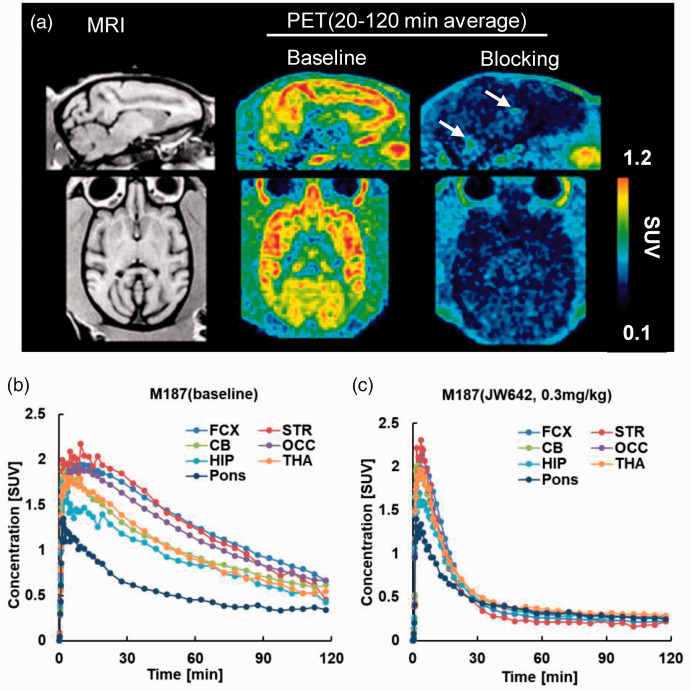
Figure 2.
(a) Sagittal (upper) and axial (lower) MR(left) and PET images at baseline (center) and following pretreatment with 0.3 mg/kg of JW642 (right). PET images were generated by averaging dynamic scan data at 60–120 min. Arrows in the sagittal PET image under the blocking condition indicate radioactivity accumulations in the choroid plexus. (b, c) TACs for [18F]T-401 at baseline (b) and following pretreatment with 0.3 mg/kg of JW642 (c). FCX: frontal cortex; STR: striatum; CB: cerebellum; OCC: occipital; HIP: hippocampus; THA: thalamus.

