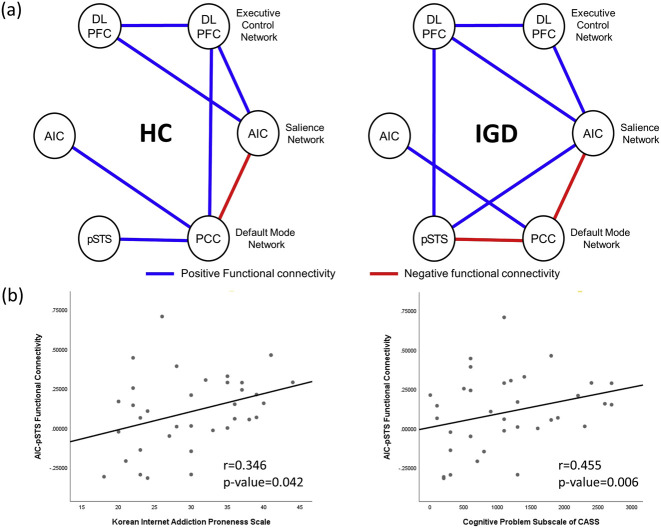
Fig. 2.
Between-network connectivity and functional connectivity correlation with clinical variables. (a) Seed-to-seed within-group analysis (blue line: positive functional connectivity; red line: negative functional connectivity). The statistical inferences were thresholded using an FDR-corrected P value<0.05. In IGD group, functional connectivity of pSTS to left DLPFC and right AIC was newly identified which were not observed in HC group, while alteration in pSTS-PCC functional connectivity (positive to negative) was also found in IGD. Functional connectivity of PCC with right DLPFC shown in HC was not significant in IGD. (b) Pearson correlation analysis for clinical correlation of functional connectivity. We identified positive correlation between AIC-pSTS functional connectivity and total score of Korean Internet Addiction Proneness Scale (r = 0.346, P = 0.042), and positive correlation between AIC-pSTS functional connectivity and cognitive problem subscale of Conners-Wells Adolescents Self-report Scale (r = 0.455, P-value = 0.006)

