
Fig. 2.
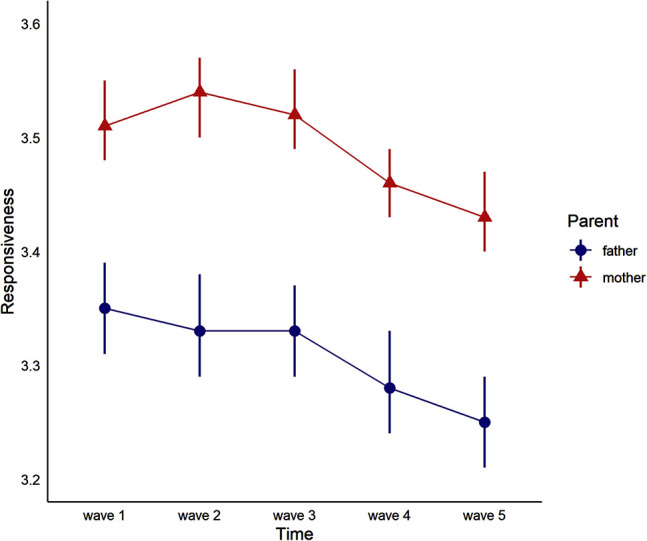
The between-waves development of maternal and paternal responsiveness. Means and 95% CI are presented for each wave. N = 1,019 for both variables in all waves. Note. In case of maternal responsiveness, Games–Howell post-hoc tests were significant (P < 0.001) for differences between waves 1–4 (Cohen d = 0.10), 1–5 (d = 0.14), 2–4 (d = 0.15), 2–5 (d = 0.20), 3–4 (d = 0.13), 3–5 (d = 0.17). In case of paternal responsiveness, Games-Howell post-hoc tests were significant (P < 0.001) for differences between waves 1–4 (d = 0.10), 1–5 (d = 0.15), 2–5 (d = 0.13), 3–5 (d = 0.13).