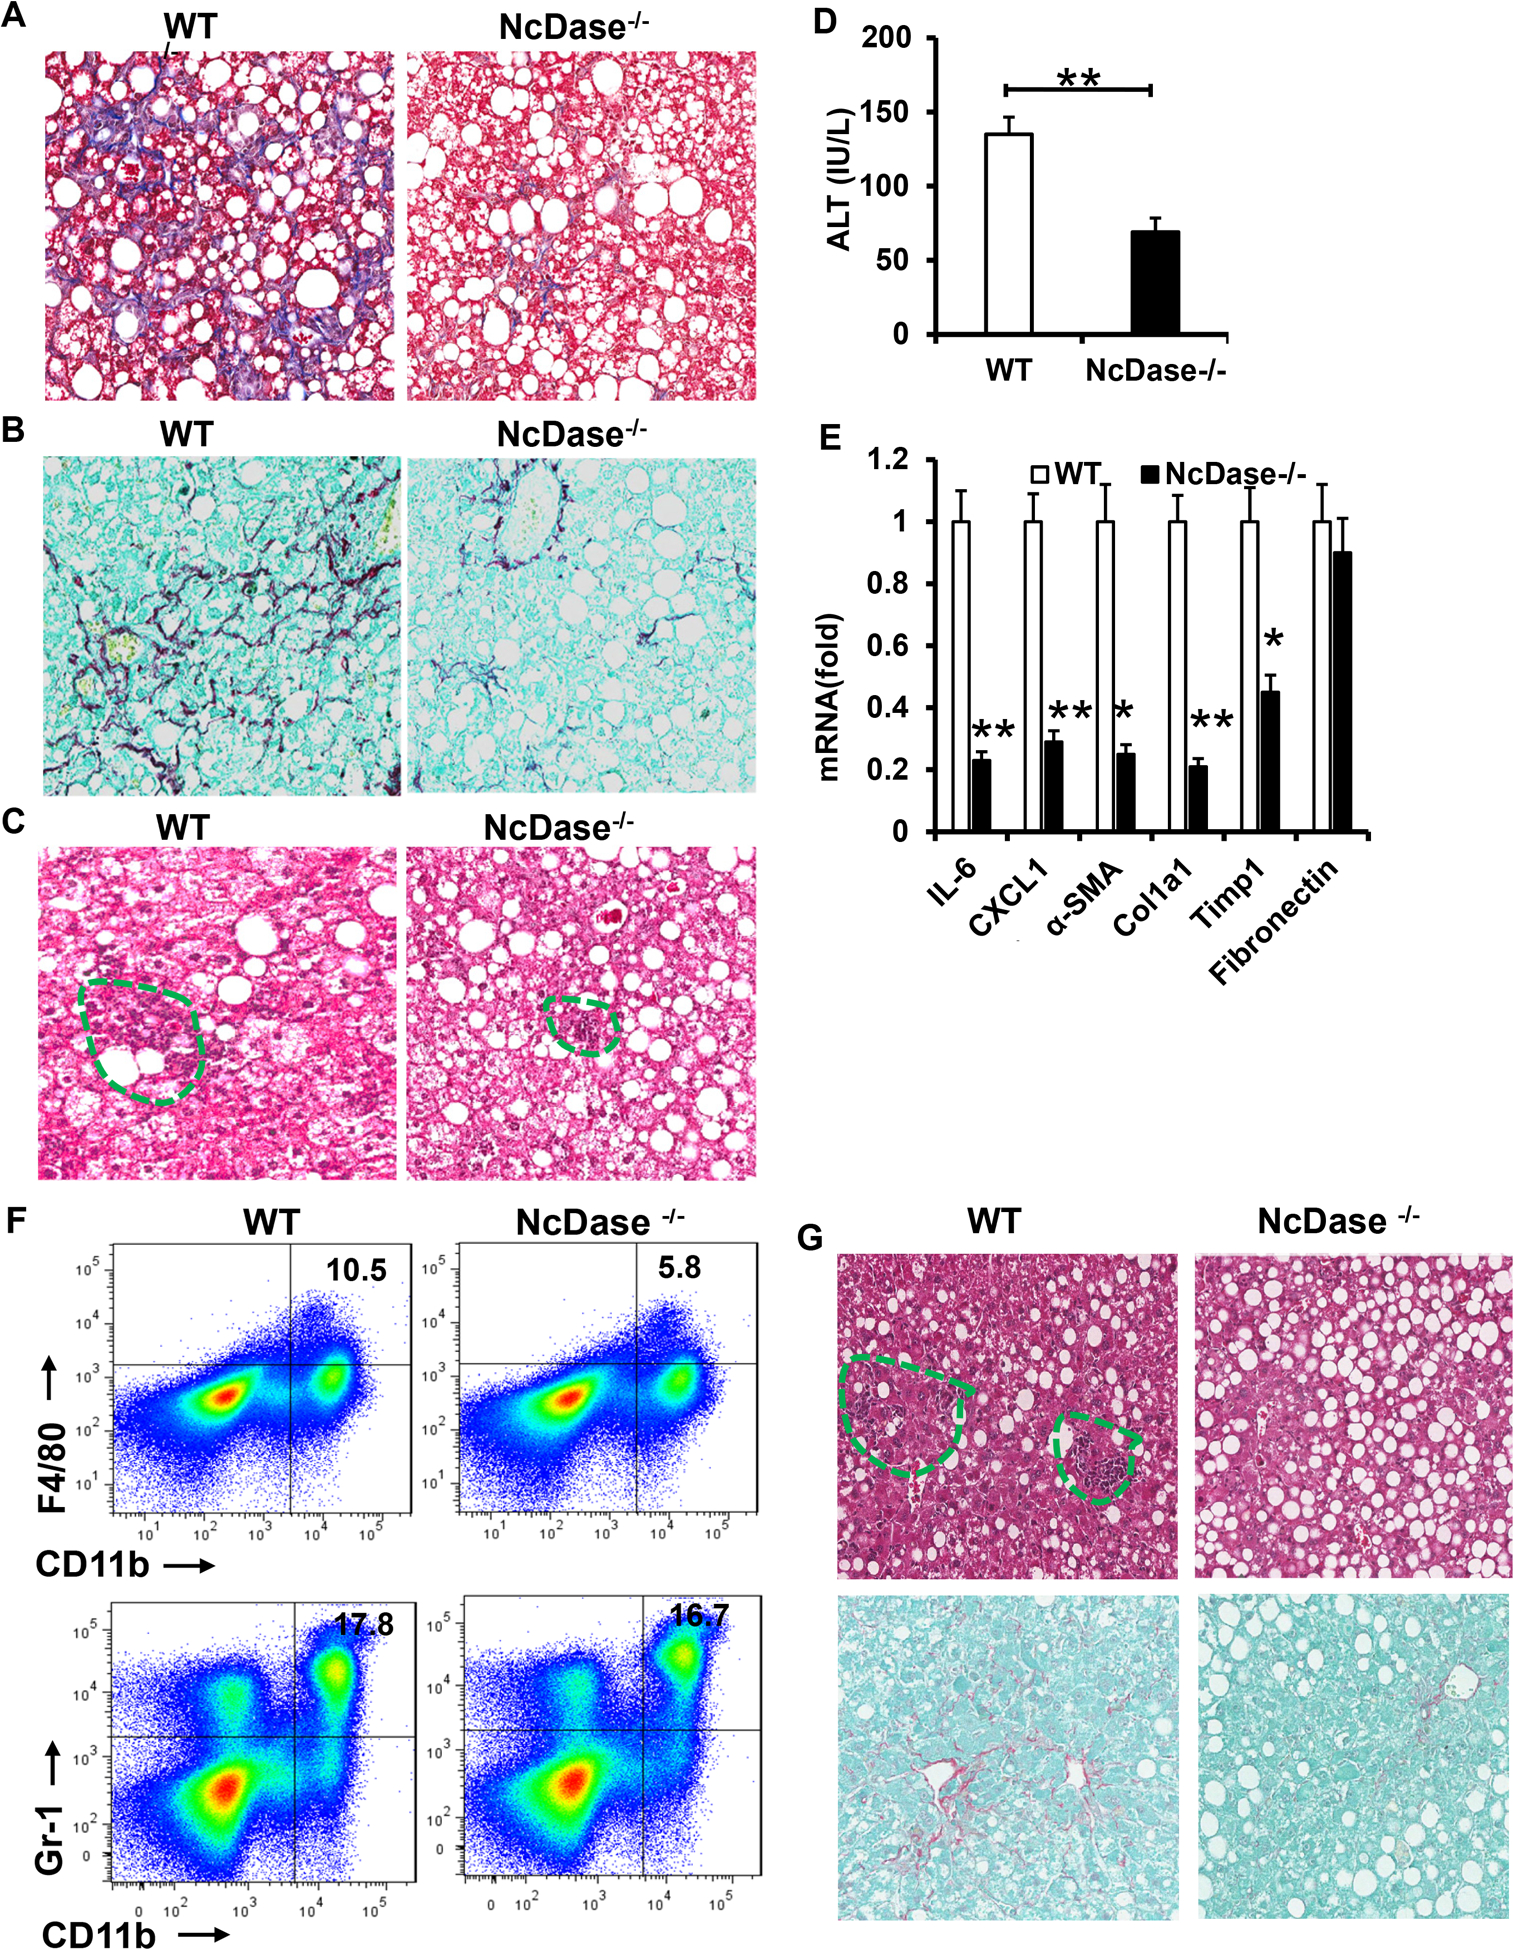
Figure 2. NcDase deficiency reduces liver inflammation, fibrosis, and cell death in HSPC-or MCD-fed mice.

WT mice or NcDase−/− mice were fed the HSPC diet (A-F) or MCD diet (G).
(A-C) Masson’s trichrome staining (A), Sirius red staining (B) or H&E staining (C) of liver sections.
(D) Serum ALT levels.
(E) mRNA levels of the indicated genes related to inflammation and fibrosis in liver.
(F) FACS analysis of CD11b+F4/80+ macrophages and CD11b+Gr-1+ iMCs/MDSCs in the liver.
(G) H&E staining (top) or Sirius red (bottom) staining of liver sections in MCD-fed mice.
Mean ± SEM; n = 10, *p < 0.05, **p < 0.01.
