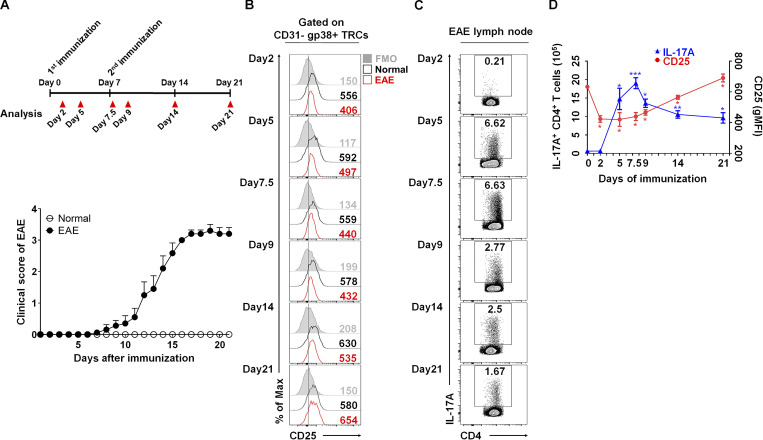
Figure 4.
Dynamic expression of CD25 on TRCs during EAE induction. (A) The overall scheme and severity of EAE induction (n ≥ 10 per each group). (B) The expression of CD25 on CD31−gp38+ gated TRC population from normal (black lines) or EAE-induced (red lines) freshly isolated iLNs is shown by flow cytometric histograms at the designated time points. Gray histograms represent isotype control. (C) The frequency of IL-17A–producing CD4+ T cells in iLN, as detected by flow cytometry at the indicated time points. (D) Compiled data show the kinetics of IL-17A+CD4+ T cells and CD25+ TRCs in iLN during EAE induction. *, P < 0.05; **, P < 0.01; ***, P < 0.001 compared with day 0 results. Error bars indicate the mean ± SEM (n = 4 per each group). Data are representative of three independent experiments.

