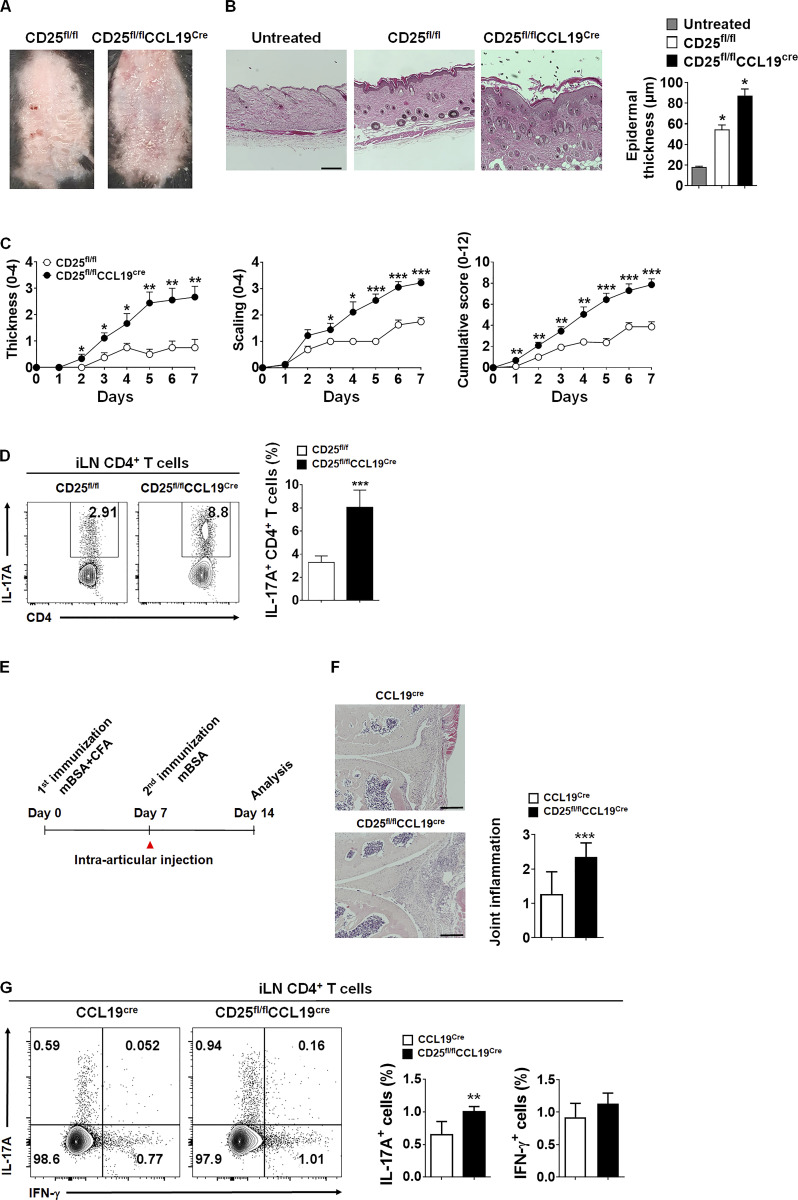
Figure 7.
Experimental psoriasis and AIA are aggravated in mice with TRC-specific CD25 deletion. (A) Representative image of phenotypical psoriasiform skin lesions from IMQ-treated CD25fl/fl and CD25fl/flCCL19cre mice. (B) H&E-stained skin sections and compiled data of epidermal thickness are depicted. Scale bar = 250 μm. *, P < 0.05 compared with CD25fl/fl mice. Error bars indicate the mean ± SEM (n = 8 per each group). (C) The severity of thickness and scaling on back skin and cumulative scores were evaluated in IMQ-treated CCL19cre and CD25fl/flCCL19cre mice. The cumulative score of psoriasis area and severity index includes skin thickness, scaling, and erythema scores. *, P < 0.05; **, P < 0.01; ***, P < 0.001 compared with CD25fl/fl mice. Error bars indicate the mean ± SEM (n = 8 per each group). (D) IL-17A+ CD4+ T cell populations were analyzed by flow cytometry. Representative flow cytometric plots (left) and compiled data (right) are described. ***, P < 0.001 compared with CD25fl/fl mice. Error bars indicate the mean ± SEM (n = 8 per each group). (E) The experimental scheme of AIA model. CCL19cre and CD25fl/flCCL19cre mice were immunized with mBSA emulsified with CFA as described in Materials and methods. (F) Pathological sections of CCL19cre and CD25fl/flCCL19cre mouse knee joints stained with H&E (left). Scale bar = 250 μm. Compiling data are depicted (right). ***, P < 0.001 compared with CCL19cre mice. Error bars indicate the mean ± SEM (n = 5–6 per each group). (G) IFN-γ+ and IL-17A+ CD4+ T cell populations after mBSA restimulation were analyzed by flow cytometry from iLNs of AIA-induced mice. Flow cytometry (left) and compiling data (right) are described. **, P < 0.01 compared with CCL19cre mice. Error bars indicate the mean ± SEM (n = 5–6 per each group). Data are representative of three independent experiments.

