. 2022 Feb 23;13(12):3416–3423. doi: 10.1039/d1sc06745a

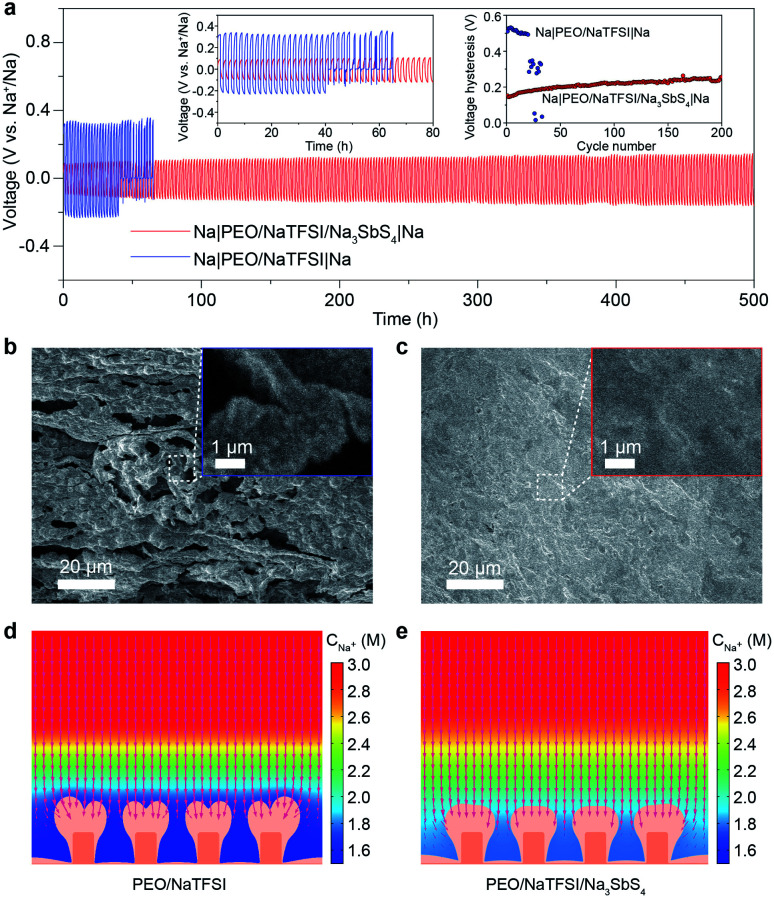
Fig. 5. Characterization and performance of all-solid-state Na|Na symmetric cells. (a) Voltage profiles of symmetric cells with the PEO/NaTFSI electrolyte and PEO/NaTFSI/Na3SbS4 electrolyte at 50 μA cm−2 and 45 °C. Insets: detailed voltage profiles and evolution of total overpotentials in different symmetric cells. SEM images of the Na metal after cycling in different symmetric cells with (b) the PEO/NaTFSI electrolyte and (c) the PEO/NaTFSI/Na3SbS4 electrolyte. The FEM simulation results of Na deposition after 9600 s in (d) the PEO/NaTFSI electrolyte and (e) the PEO/NaTFSI/Na3SbS4 electrolyte. The red arrows represent the Na+ flux in the electrolyte for deposition to proceed. The bulge area of the electrode with deeper orange represents the pristine electrode surface and the lighter orange area represents the newly deposited Na layer.

Fig. 5