. 2022 Feb 25;13(12):3468–3476. doi: 10.1039/d1sc06976d

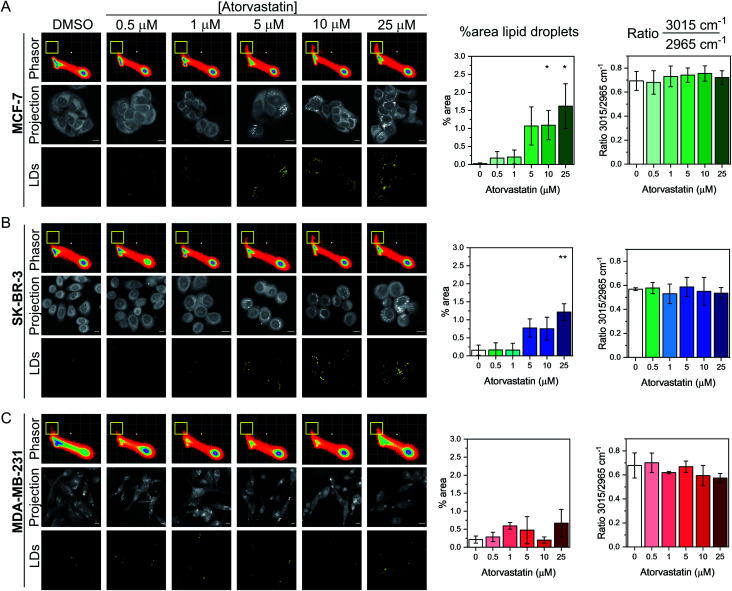
Fig. 4. Investigating the effect of atorvastatin in breast cancer cells using a spectral phasor approach. Spectral phasor plots were generated from (A) MCF-7, (B) SK-BR-3 and (C) MDA-MB-231 cells treated with atorvastatin at the indicated concentrations for 48 h. An average intensity projection from the SRS spectral sweep is presented alongside the segmented phasor plot indicating lipid droplets (LDs, identified by the yellow ROI in the spectral phasor plot). Scale bars: 10 μm. For each cell line, the percentage area of lipid droplets in the segmented image is expressed as a function total cell area (determined from the average intensity projection), and the ratio of the intensity of the peaks at 3015 cm−1/2965 cm−1 is plotted as a function of atorvastatin concentration. Three replicate analyses were obtained from >30 cells for each condition. Data represent the mean ratio ± S.D. A Student's t-test is performed on the percentage area data, *P ≤ 0.05, **P ≤ 0.01.

Fig. 4