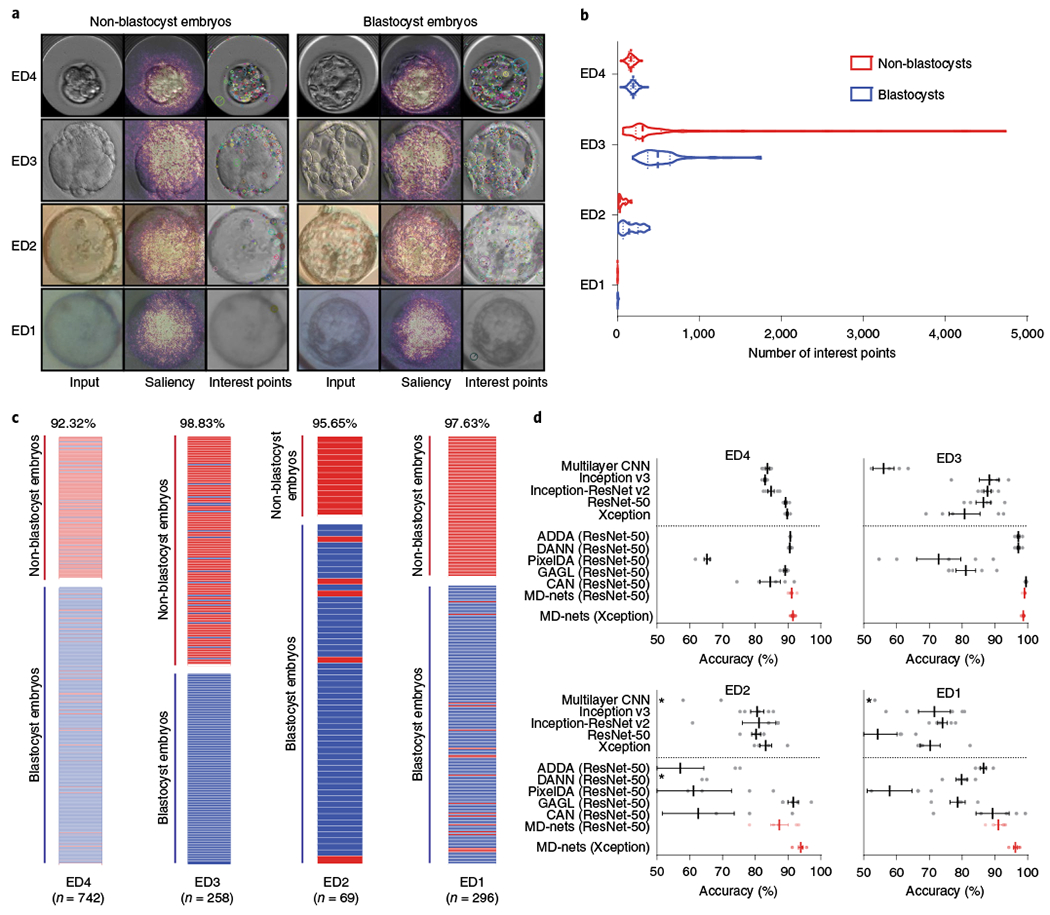
Fig. 2 |. Comparison of supervised CNNs and domain adaptation methods for the morphological analysis of human embryo images.

a, The embryo image datasets were collected from a clinical time-lapse system (ED4), various clinical brightfield inverted microscopes (ED3), a portable 3D-printed imaging system (ED2) and a 3D-printed smartphone-based imaging system (ED1). The overlaid saliency maps help to visualize pixels that are most utilized by the MD-nets in their decision-making. The interest points are examples of strong features of different embryo images identified by the SIFT algorithm. b, The distribution of feature points in non-blastocyst and blastocyst-stage embryo images collected from ED4 (n = 251 and n = 491), ED3 (n = 141 and n = 117), ED2 (n = 13 and n = 56) and ED1 (n = 99 and n = 197). The dashed lines represent the median and dotted lines represent quartiles. c, The performance of MD-nets in evaluating embryo images collected using different imaging systems on the basis of their developmental stage. The red bars represent non-blastocysts and the blue bars represent blastocysts. d, The performance of MD-nets in embryo image classification compared to different supervised learning models trained with only the ED4 dataset (source) and unsupervised domain adaptation strategies implemented with ResNet-50, when tested on target test datasets of ED4 (n = 742), ED3 (n = 258), ED2 (n = 69) and ED1 (n = 296). The dotted line separates the domain adaptation methods from the supervised models. Each result represents the average of five random initialization seeds and the error bars represent the s.e.m. The asterisks indicate performance averages of below 50%. The dots represent the individual performance values of each model.
