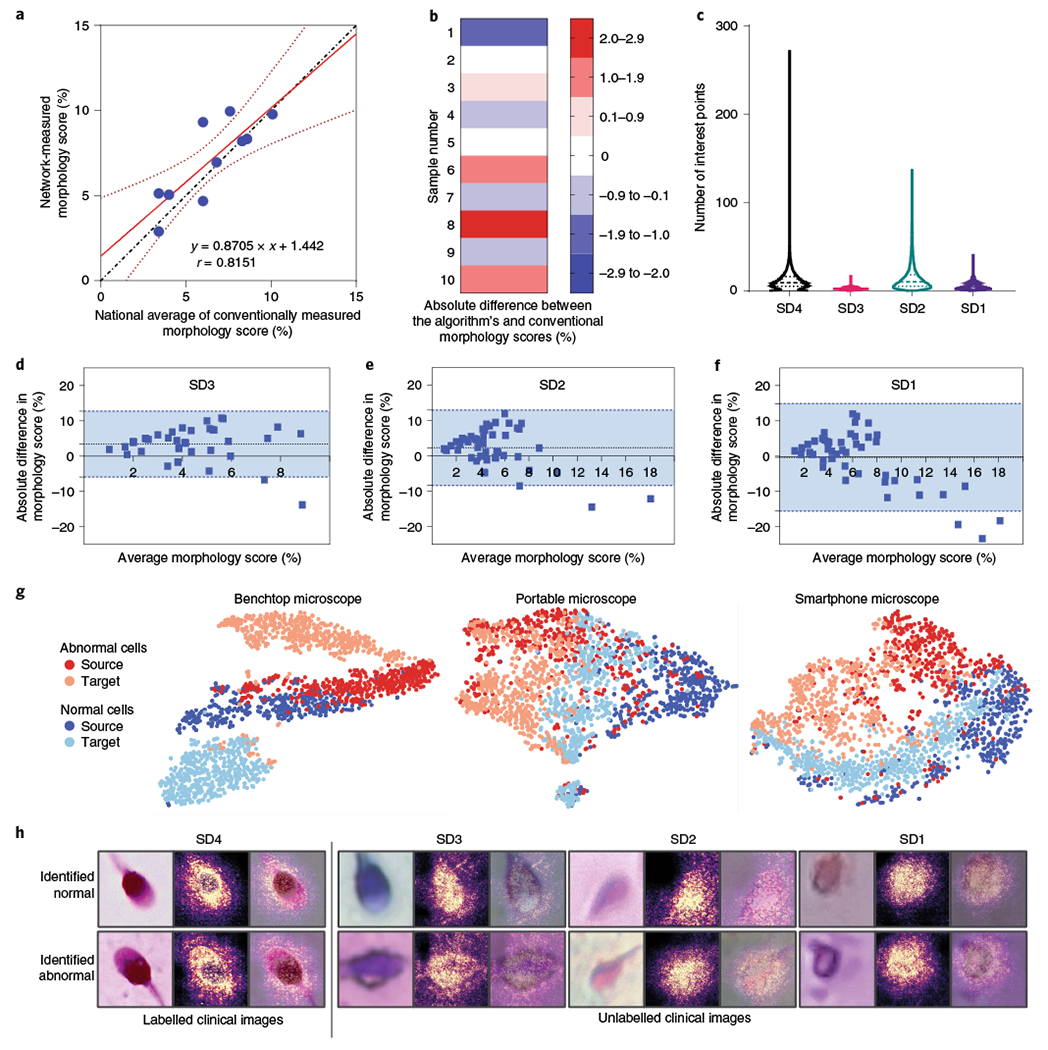
Fig. 3 |. Assessment of the performance of MD-nets in quantitatively evaluating cell morphology using human sperm cells as a clinical model.

a, Linear regression plot (n = 10). The dotted line represents the line of identity. The solid red line represents the best-fitting straight line on the available data points identified using a least-squares analysis. The dotted red line represents the 95% confidence interval of the fitted line. The equation represents the line equation of the fitted line and r represents the Pearson’s correlation coefficient (P = 0.004). b, The absolute difference between morphological scores of human semen samples (SD4) when measured using automated MD-net and manual-based assessment (national average) performed using conventional manual microscopy. n = 10. c, Comparison of distributions of SIFT feature points per image identified across the various domain-shifted datasets of microscopic sperm images. SD4, n = 86,440; SD3, n = 18,972; SD2, n = 19,668; and SD1, n = 20,554. Feature estimates are not separated by classes as manual annotations are unavailable. The dashed lines represent the median and the dotted lines represent quartiles. d–f, Bland-Altman tests comparing morphology scores estimated on the basis of manual microscopy analysis and MD-net using sperm samples imaged using a benchtop microscope (d) (SD3, n = 40); a portable 3D-printed microscope (e) (SD2, n = 48); and a portable smartphone-based microscope (f) (SD1, n = 47). The dotted lines indicate the mean bias and the blue region within the blue dashed lines indicates the 95% limits of agreement. g, t-SNE plots illustrating source and target clustering achieved by MD-net for the four different sperm datasets. h, Examples of sperm images that were collected using the different optical instruments along with the associated saliency maps obtained from the MD-net feature extractor.
