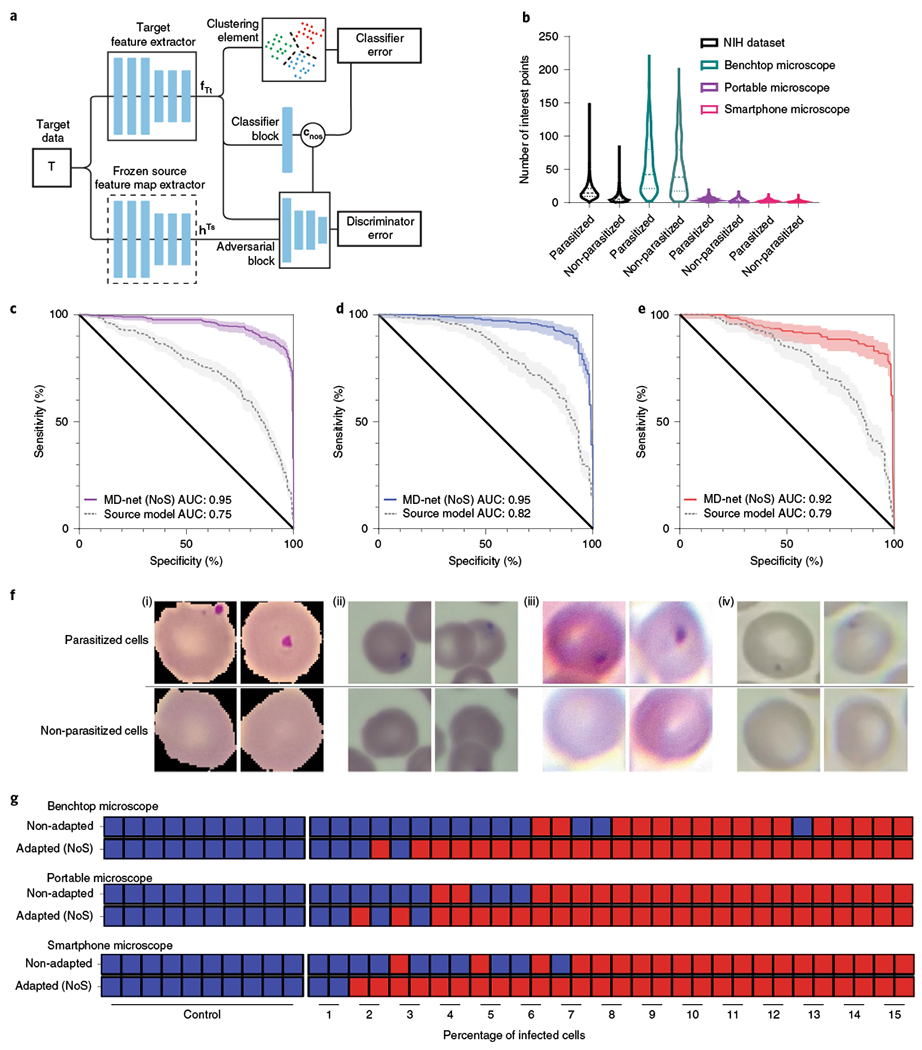
Fig. 4 |. Performance of MD-nets (NoS) in the evaluation of malaria-infected samples.

a, Schematic of the adversarial neural network scheme showing the preloaded frozen layers and trainable layers. This version of MD-nets makes use of a clustering element and pretrained source weights and is designed to not use any source data during adaptation while using only unlabelled target data. fTt and hTs represent the feature representations of the target feature extractor and multilinear maps of the frozen source feature extractor, respectively. cnos represents the classifier predictions. b, Comparison of the distributions of SIFT feature points per image identified across the various domain-shifted datasets of microscopy images of parasitized and non-parasitized cells. Samples from non-parasitized MD3 (n = 601), MD2 (n = 688), MD1_t (n = 1,896) and MD1_s (n = 12,401), and parasitized MD3 (n = 601), MD2 (n = 688), MD1_t (n = 1,896) and MD1_s (n = 12,401) were used in the SIFT feature measurements. The dashed lines represent the median and the dotted lines represent quartiles. NIH, National Institutes of Health. c–e, Receiver operator characteristics analyses were conducted to compare the performance of MD-net (NoS) before and after adaptation with preloaded weights on MD3 (c), MD2 (d) and MD1_t (e). The shaded regions represent the 95% confidence intervals. f, Example images of parasitized and non-parasitized cells from the different malaria datasets MD1_s (i), MD2 (ii), MD3 (iii) and MD1_t (iv). g, Qualitative diagnostic performance of MD-net (NoS) before and after no-source adaptation to domain-shifted data collected using a benchtop microscope, a portable microscope and a smartphone microscope (n = 40). The blue squares represent image sets that were qualitatively predicted to be negative for malaria and the red squares represent those that were predicted to be positive for malaria.
