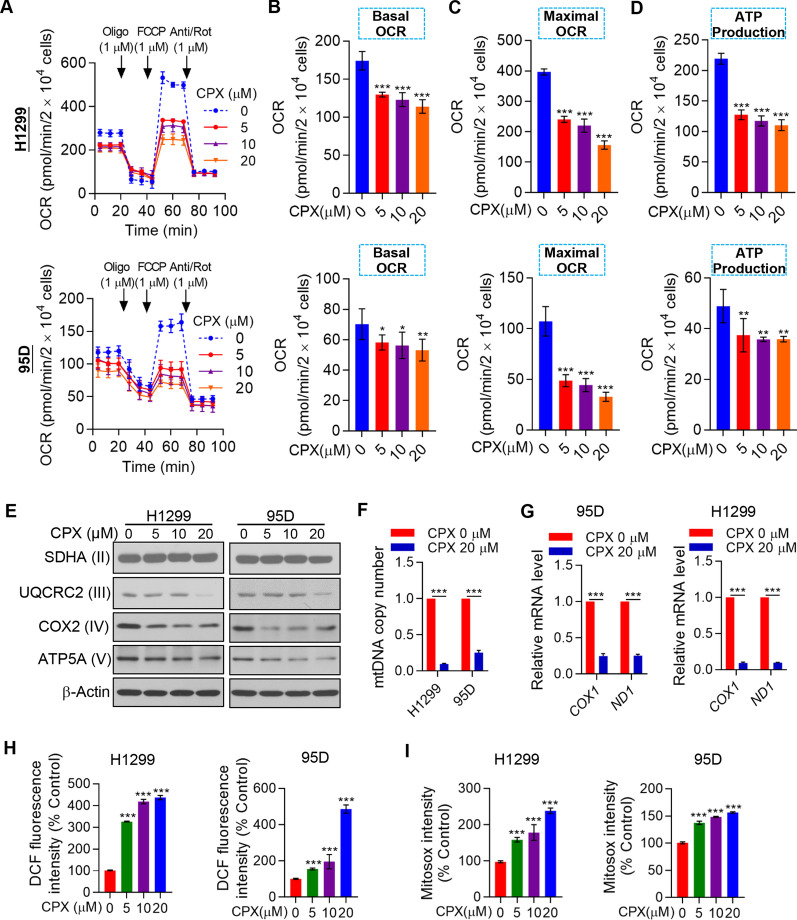
Fig. 3.
Mitochondrial respiration dysfunction and ROS induction in CPX-treated NSCLC cells. A The OCR in H1299 and 95D cells with the treatment of CPX (0, 5, 10, and 20 μM) assayed by Seahorse XF96 bioenergy analyzer. B–D The basal and maximal respiration (B and C), and the ATP production (D) were shown. E H1299 and 95D cells with the treatment of CPX (0, 5, 10, 20 μM) for 48 h, and cells were collected and the whole cell lysate was detected by Western blotting analysis. F H1299 and 95D cells with the treatment of CPX (0, 5, 10 and 20 μM) and mitochondrial DNA number measured. G The mRNA expression levels of COX1 and ND1 in H1299 and 95D cells with the treatment of vehicle control (DMSO) or CPX (20 μM). H H1299 and 95D cells with the treatment of CPX (0, 5, 10, 20 μM) and total cellular reactive oxygen species level measured. I H1299 and 95D cells with the treatment of CPX (0, 5, 10, 20 μM) and mitochondrial reactive oxygen species (MitoSOX) level measured. Data were presented as mean ± SD (n = 3, *for p < 0.05, **for p < 0.01, ***for p < 0.001)

