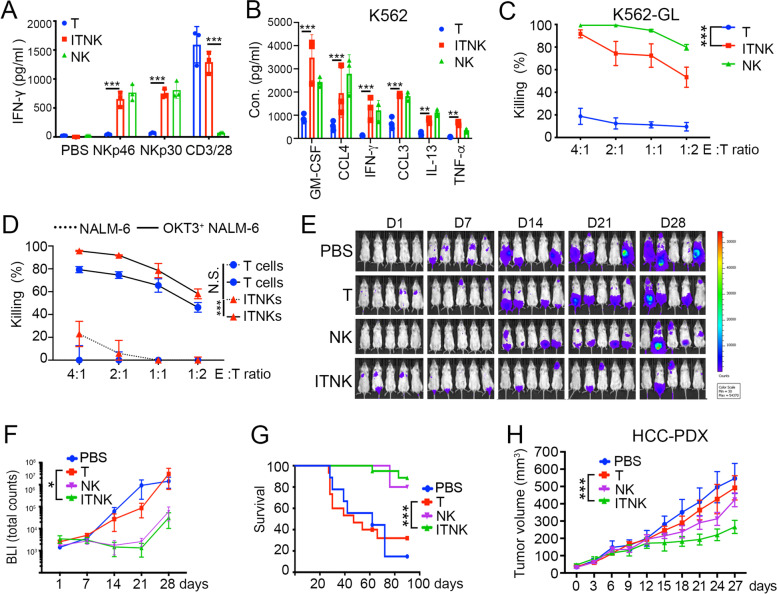
Fig. 4.
Evaluating the antitumor effects of ITNKs in vitro and in vivo. A The bar chart shows IFN-γ secretion by T cells, ITNKs and NK cells after activation for 24 h with the indicated antibodies (anti-NKp30, anti-NKp46 and anti-CD3/CD28 at 5 μg/ml). Samples were collected from three individual donors. Data are shown as the mean ± SD; *P ≤ 0.05 and ***P ≤ 0.001; two-way ANOVA with Tukey’s multiple comparisons test. B Cytokine secretion profiles of ITNKs, T cells, and NK cells in coculture with K562 cells. ITNKs, T cells, and NK cells were incubated with K562 cells at an E:T ratio of 1:1 for 24 h. The supernatants were then harvested, and the concentrations of the indicated cytokines were measured by a multiplex immunoassay. The values shown represent the mean ± SD of 3 different donors. **P ≤ 0.01 and ***P ≤ 0.001; two-way ANOVA with Tukey’s multiple comparisons test. C Killing assays showing the percent cytotoxicity of ITNKs, NK cells and T cells against K562 cells. The data are shown as the mean ± SD; P < 0.0001 (ITNKs vs. T cells for K562 cells) and ***P ≤ 0.001; two-way ANOVA with Tukey’s multiple comparisons test. D The percent cytotoxicity of ITNKs and T cells against NALM-6 and OTK3-overexpressing NALM-6 cells in coculture. The results were obtained from three independent experiments. P < 0.0001 (ITNKs lysing OKT3+ NALM-6 cells vs. ITNKs lysing NALM-6 cells) and ***P ≤ 0.001; two-way ANOVA with Tukey’s multiple comparisons test. E Bioluminescence images showing the fate of K562 cells transplanted into NSI mice at the indicated time points. F Quantification of the total flux analyzed by in vivo bioluminescence imaging of luciferase activity (n = 5, per group). The results represent the mean ± SD; P = 0.0347 (ITNKs vs. T cells) and *P ≤ 0.05; two-way ANOVA with Tukey’s multiple comparisons test. G Survival analysis of mice treated with PBS (n = 10), T cells (n = 15), ITNKs (n = 15), or NK cells (n = 5); P = 0.0001 (ITNKs vs. T cells) by the log-rank Mantel-Cox test. H Tumor progression of patient-derived HCC xenografts (donor: 47-year-old female with grade IV hepatocellular carcinoma) treated with PBS, T cells, ITNKs, or NK cells (n = 5). Data are shown as the mean ± SD; P = 0.0001 (ITNKs vs. T cells) by two-way ANOVA with Tukey’s multiple comparisons test, ***P ≤ 0.001

