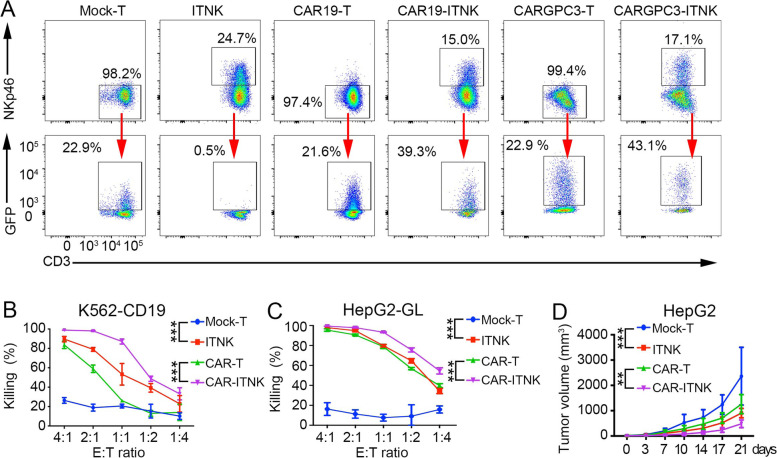
Fig. 5.
Enhanced anti-tumour activity in ITNKs engineered with CAR. A Representative flow cytometer analysis of CAR-ITNKs (CAR19-ITNKs and CARGPC3-ITNKs) which were defined as GFP + CD3 + NKp46+ on day 14 post electroporation; (B) ITNKs and T cells expressing CAR19 were co-cultured with K562 cells that expressed CD19 with the indicated ratios of effectors to targets. The percentage means of specific tumour cell lysis ± SD are shown. P < 0.0001 (CAR19-ITNK vs. CAR19-T) and P < 0.0001 (CAR19-ITNK vs. ITNK); ***P ≤ 0.001; two-way ANOVA with Tukey’s multiple comparisons test; (C) ITNK and T cells expressing CARGPC3 were co-cultured with HepG2-GL with the indicated effector to target ratios. The means of percentages of specific tumour cell lysis ± SD are shown. P < 0.0001 (CARGPC3-ITNK vs. CARGPC3-T), ***P ≤ 0.001; two-way ANOVA with Tukey’s multiple comparisons test; (D) Tumour progression of HCC xenografts treated with T, ITNK, CARGPC3-T and CARGPC3-ITNK cells (n = 5, per groups) on day 0 and day 3 when the volumes of tumours were about 50mm3. Data are shown as mean ± SD; P < 0.0001 (ITNK vs. T) and P = 0.0015 (CARGPC3-ITNK vs CARGPC3-T); two-way ANOVA with Tukey’s multiple comparisons test, **P ≤ 0.01 ***P ≤ 0.001

