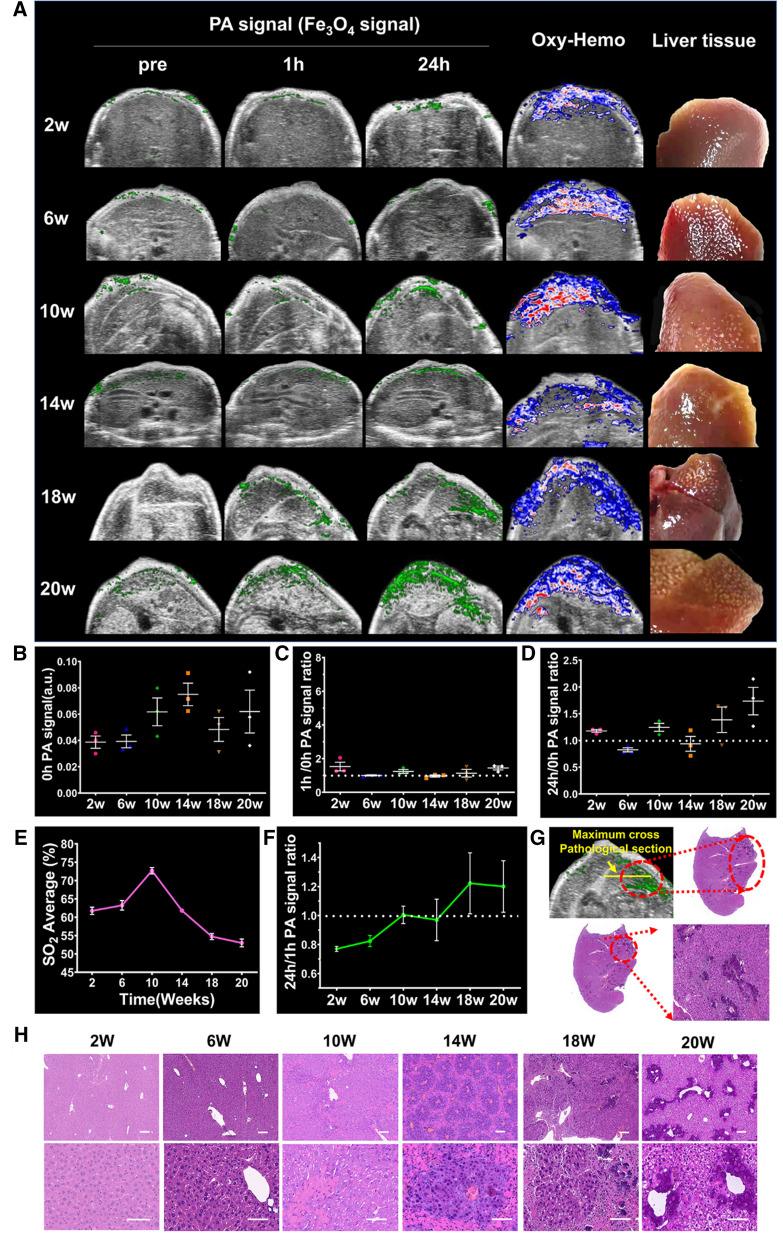
Fig. 6.
Photoacoustic imaging at different stage following the induction of hepatocellular carcinoma (HCC) in a mouse model. A Photoacoustic (PA) images were obtained before and after the injection of FGP NPs at 2, 6, 10, 14, 18, and 20 weeks after HCC induction. Oxygen saturation and autopsy images were acquired at each time point. B PA signal intensity before the injection of probe at each time point. C The 1:0-h ratio of PA signal intensity at each time point. D The 24:0-h ratio of PA signal intensity at each time point. E Oxygen saturation at each time point. F The 24:1-h ratio of PA signal intensity at each time point. G The PA images of the tumor matched the pathology of the dissected organ. H Histological examination of liver tissue at different stages of HCC. Scale bar = 50 µm

