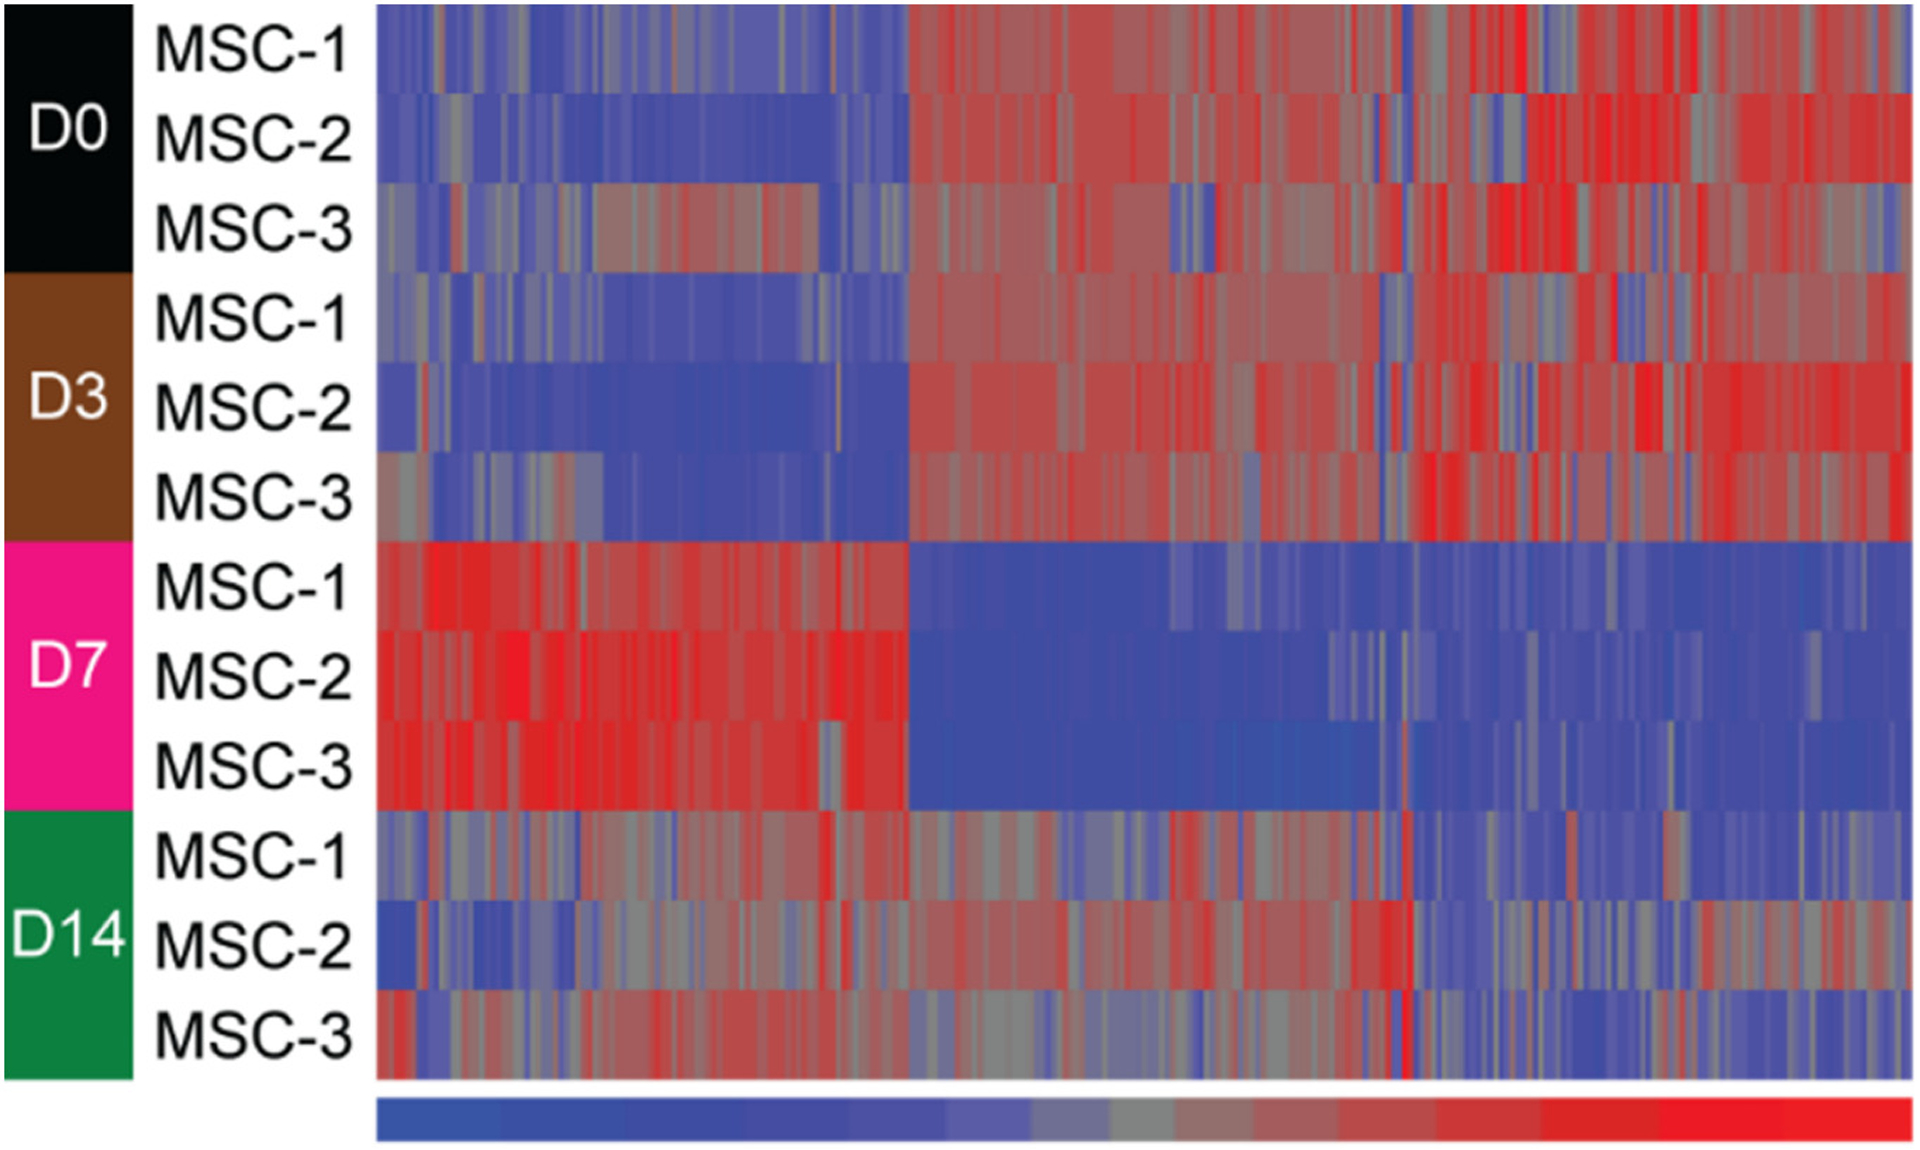
Fig. 4.

Heat map of 271 differentially-expressed mitomiRs from comparisons between day 0 and either day 7 or day 14. Significant differential expression was set at fold change absolute ≥ 1.5 and adjusted p value <0.05. These miRNAs were clustered in an unsupervised manner with Euclidean distance and Ward method. Signal values in the heat map were z-score normalized with a mean of 0 and a standard deviation of 1 across the miRNAs. Red color denotes higher signal and blue color represents lower signal. Note that there are more differentially expressed mitomiRs at the day 7 time point when compared to day 0.
