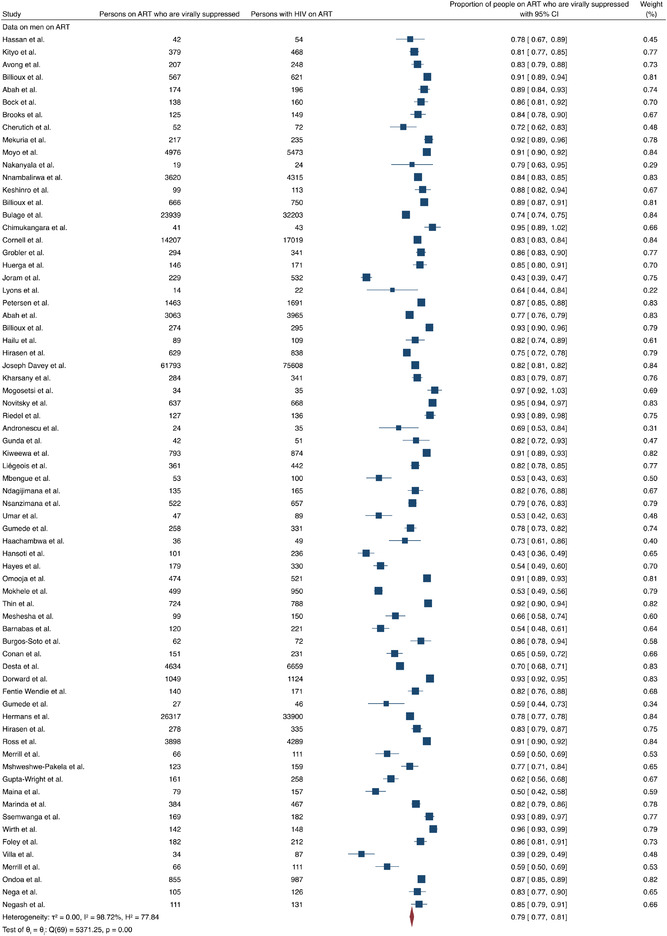
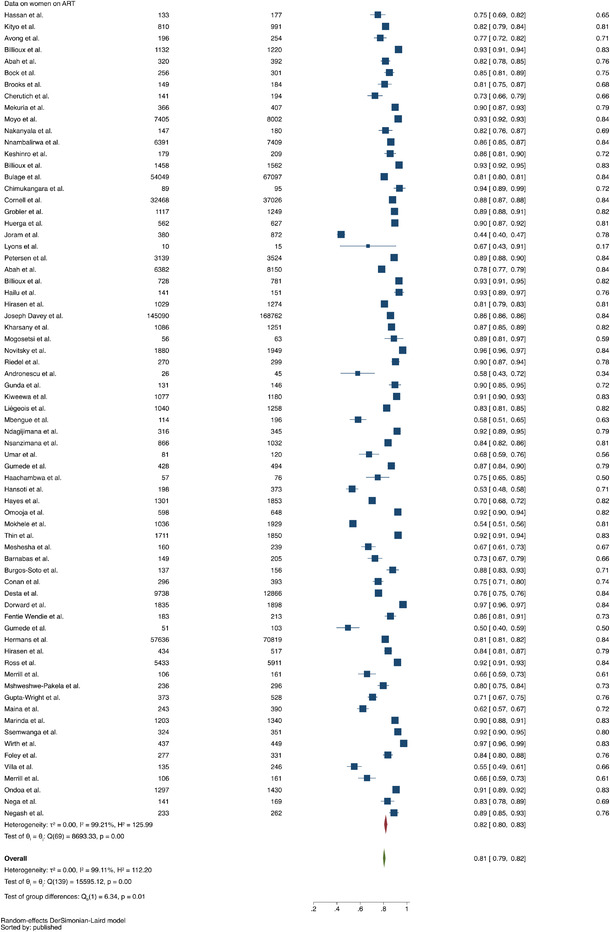
Figure A3.
(a) Forest plot comparing proportions of men and women who are virally suppressed of those on ART, including only studies reporting these data for both men and women (N=70 studies). Data for men shown here and data for women with overall comparisons shown in Figure 3b. (b) Forest plot comparing proportions of men and women who are virally suppressed of those on ART, including only studies reporting these data for both men and women (N=70 studies). Data for women and overall comparisons shown here and data for men shown in Figure 3a.


