Figure A10.

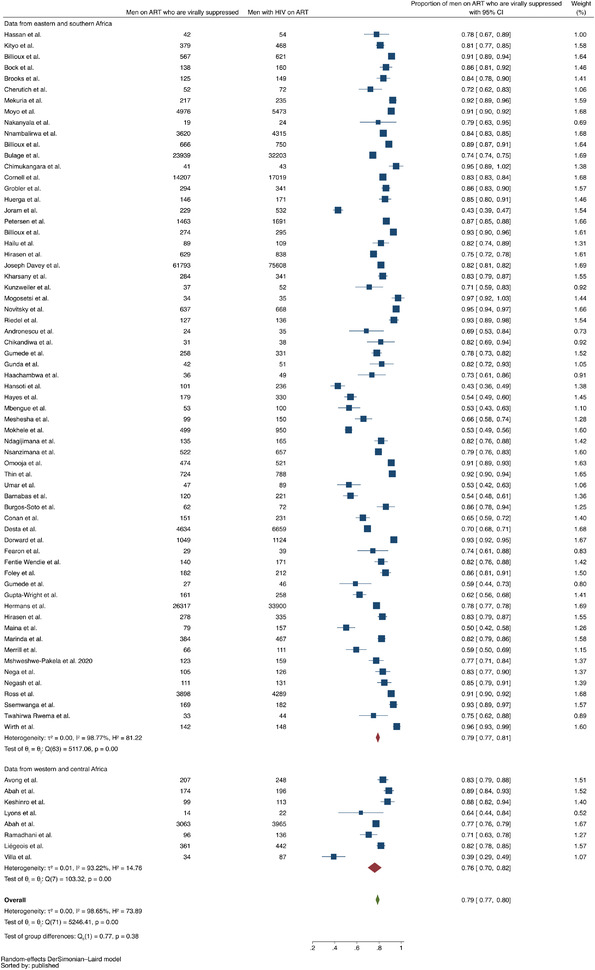
Forest plot comparing proportions of men on ART who are virally suppressed in studies conducted in eastern and southern Africa (N=64 studies) versus studies conducted in western and central Africa (N=8 studies).

Forest plot comparing proportions of men on ART who are virally suppressed in studies conducted in eastern and southern Africa (N=64 studies) versus studies conducted in western and central Africa (N=8 studies).