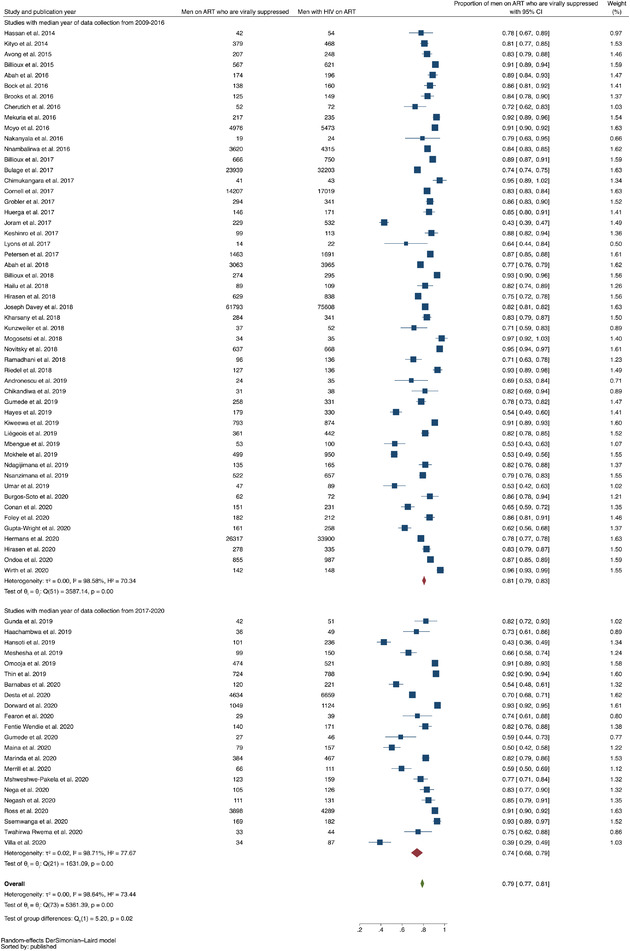
Figure A16.

Forest plot comparing proportions of men on ART who are virally suppressed in studies in which the median year of data collection was between 2009 and 2016 (N=52 studies) versus studies in which the median year of data collection was between 2017 and 2020 (N=22 studies).
