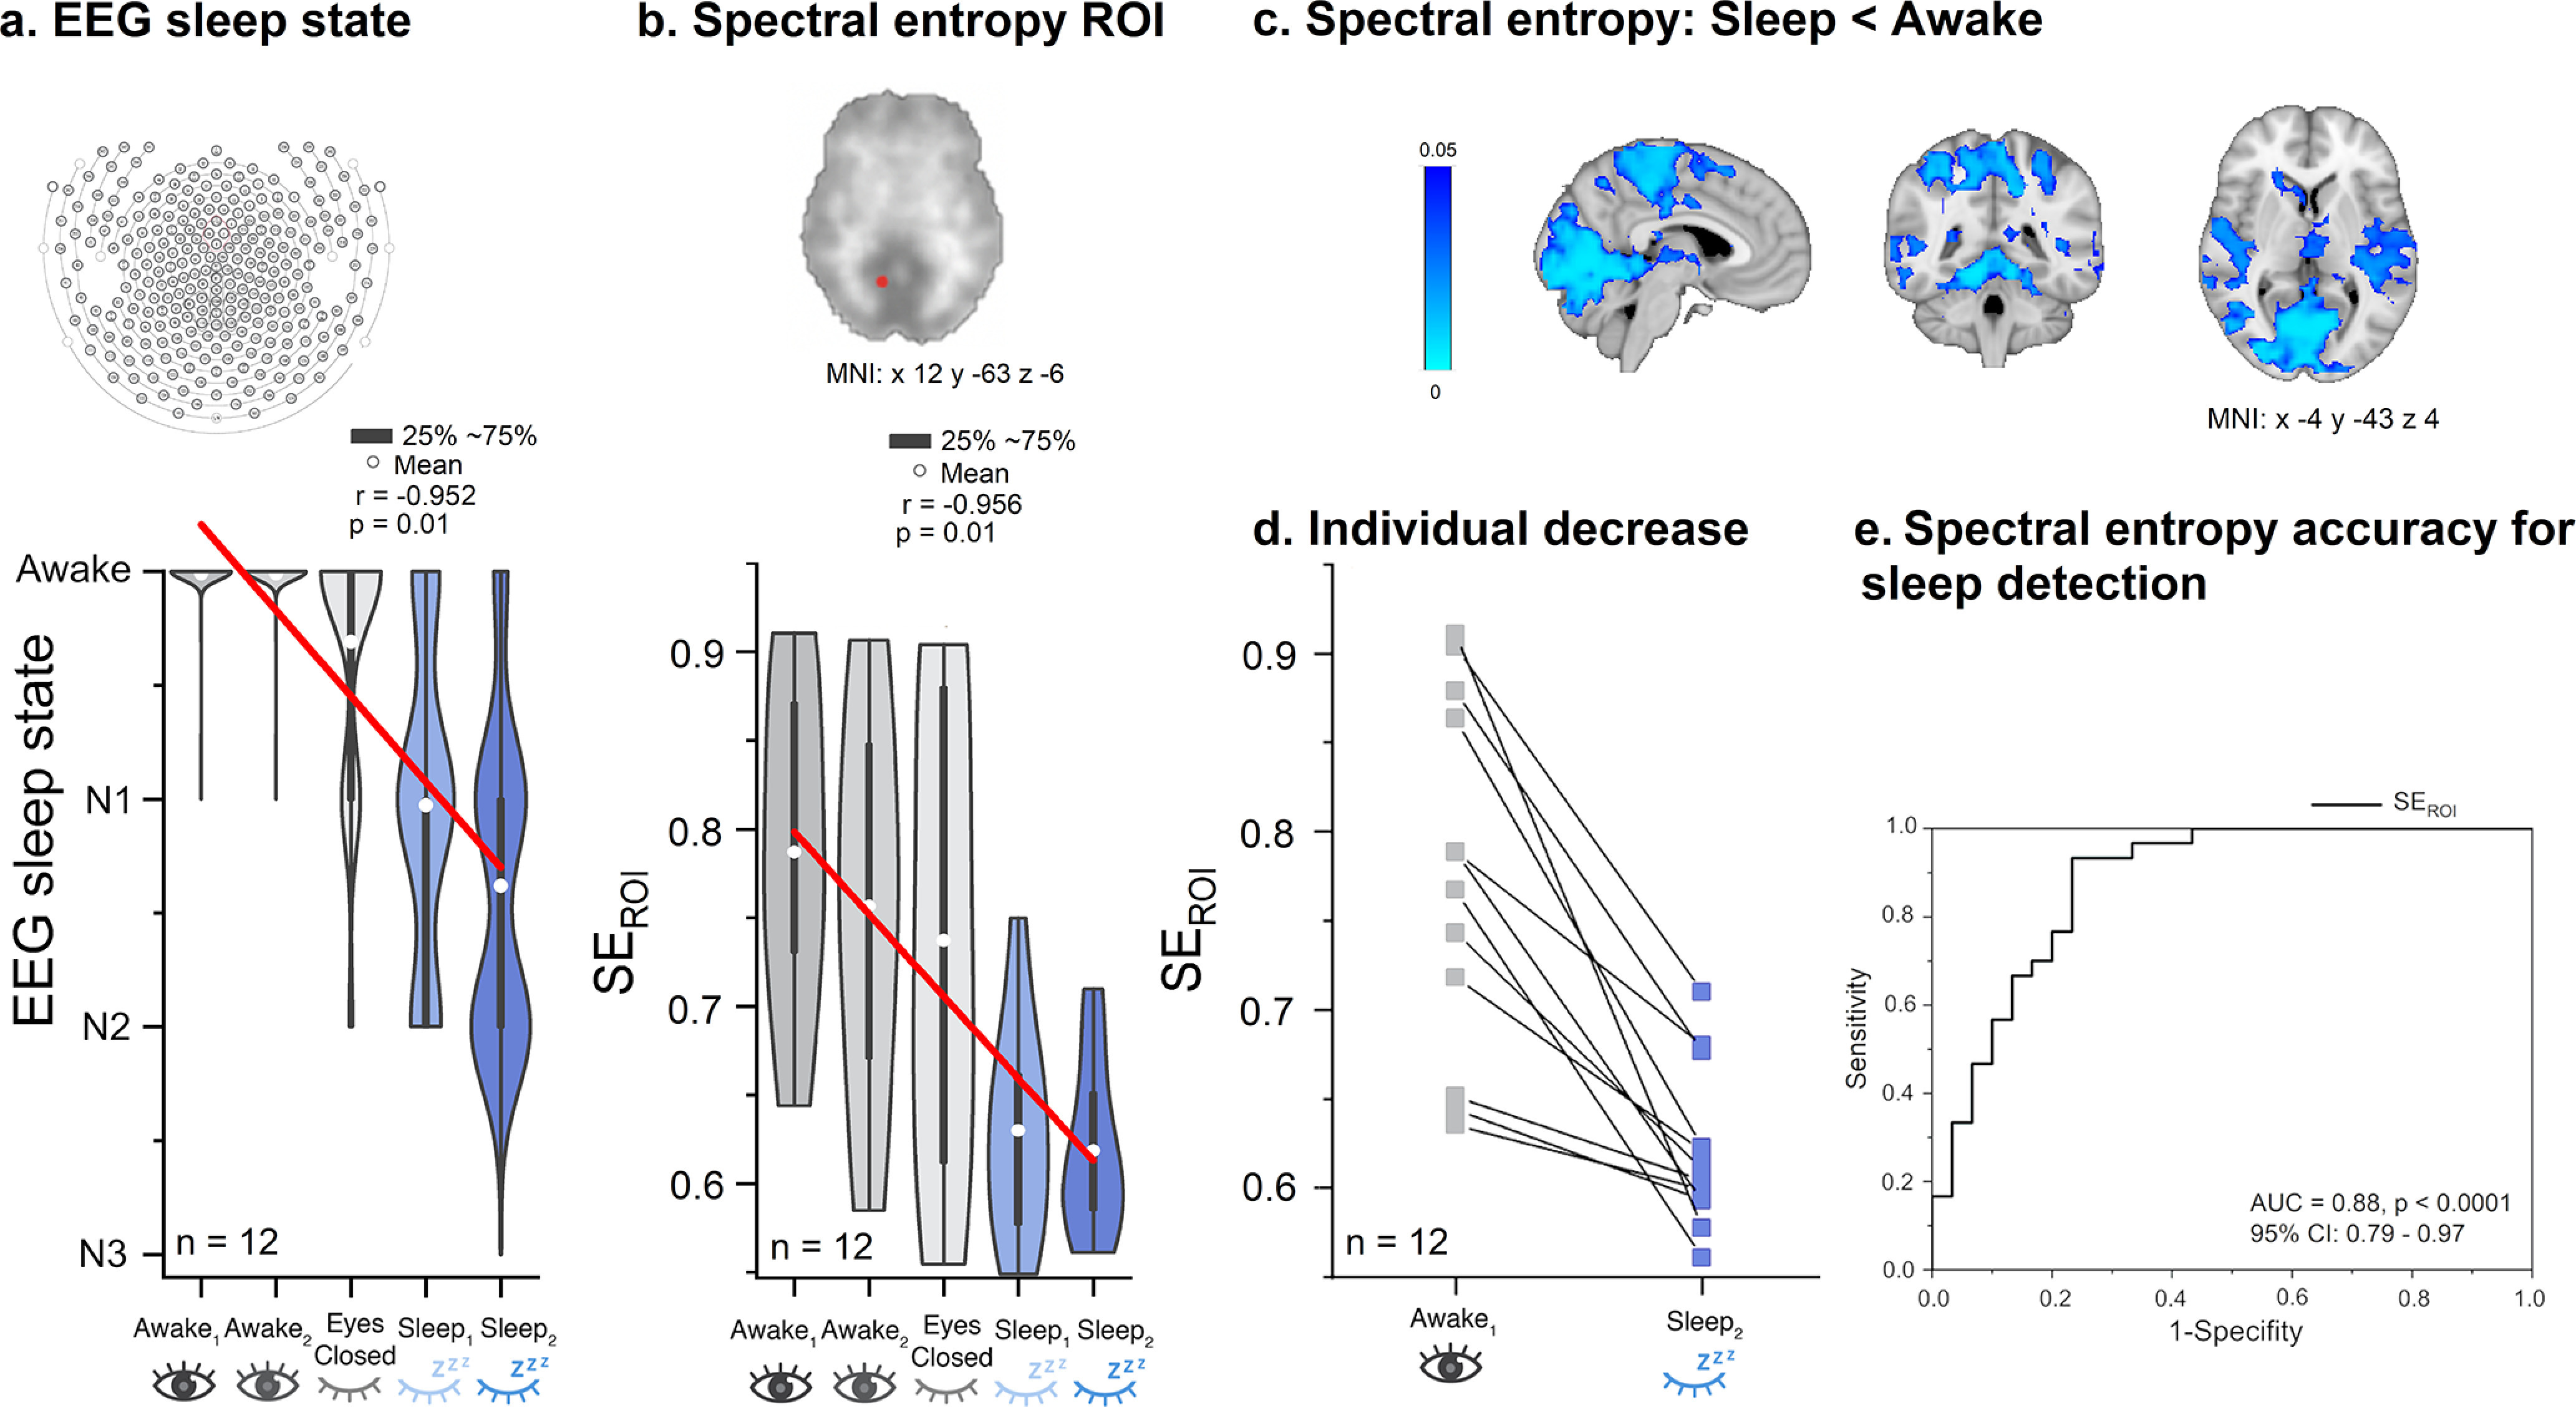
Figure 3.

Spectral entropy of MREG decreases in line with increased amount of NREM sleep. a, EEG sleep state data show that the amount and depth of sleep both increase as a function of scan segment. b, Visual cortex SEROI spectral entropy of region of interest (visual cortex, SEROI) of MREG data predicts sleep and wakefulness across subjects (n = 12). Results indicate linear declines both in EEG sleep state and MREG SEROI values as a function of scan segment in the experiment. c, Spectral entropy decreased significantly in posterior brain areas (p < 0.05, df 11). d, The SEROI showed a drop in all subjects in the transition from wakefulness to EEG-verified sleep states in S2. e, The receiver operating curve (ROC) curve of SEROI data indicate high accuracy, area under the curve (AUC) = 0.88 (p < 0.0001), in the ability to distinguish sleep (n = 30 Sleep segments) from awake data (n = 30 Awake segments). The model has a sensitivity of 93% and a specificity of 77%. p-value, p; Correlation coefficient, r; Montreal Neurologic Institute, MNI; Confidence interval, Cl.
