Figure 1.

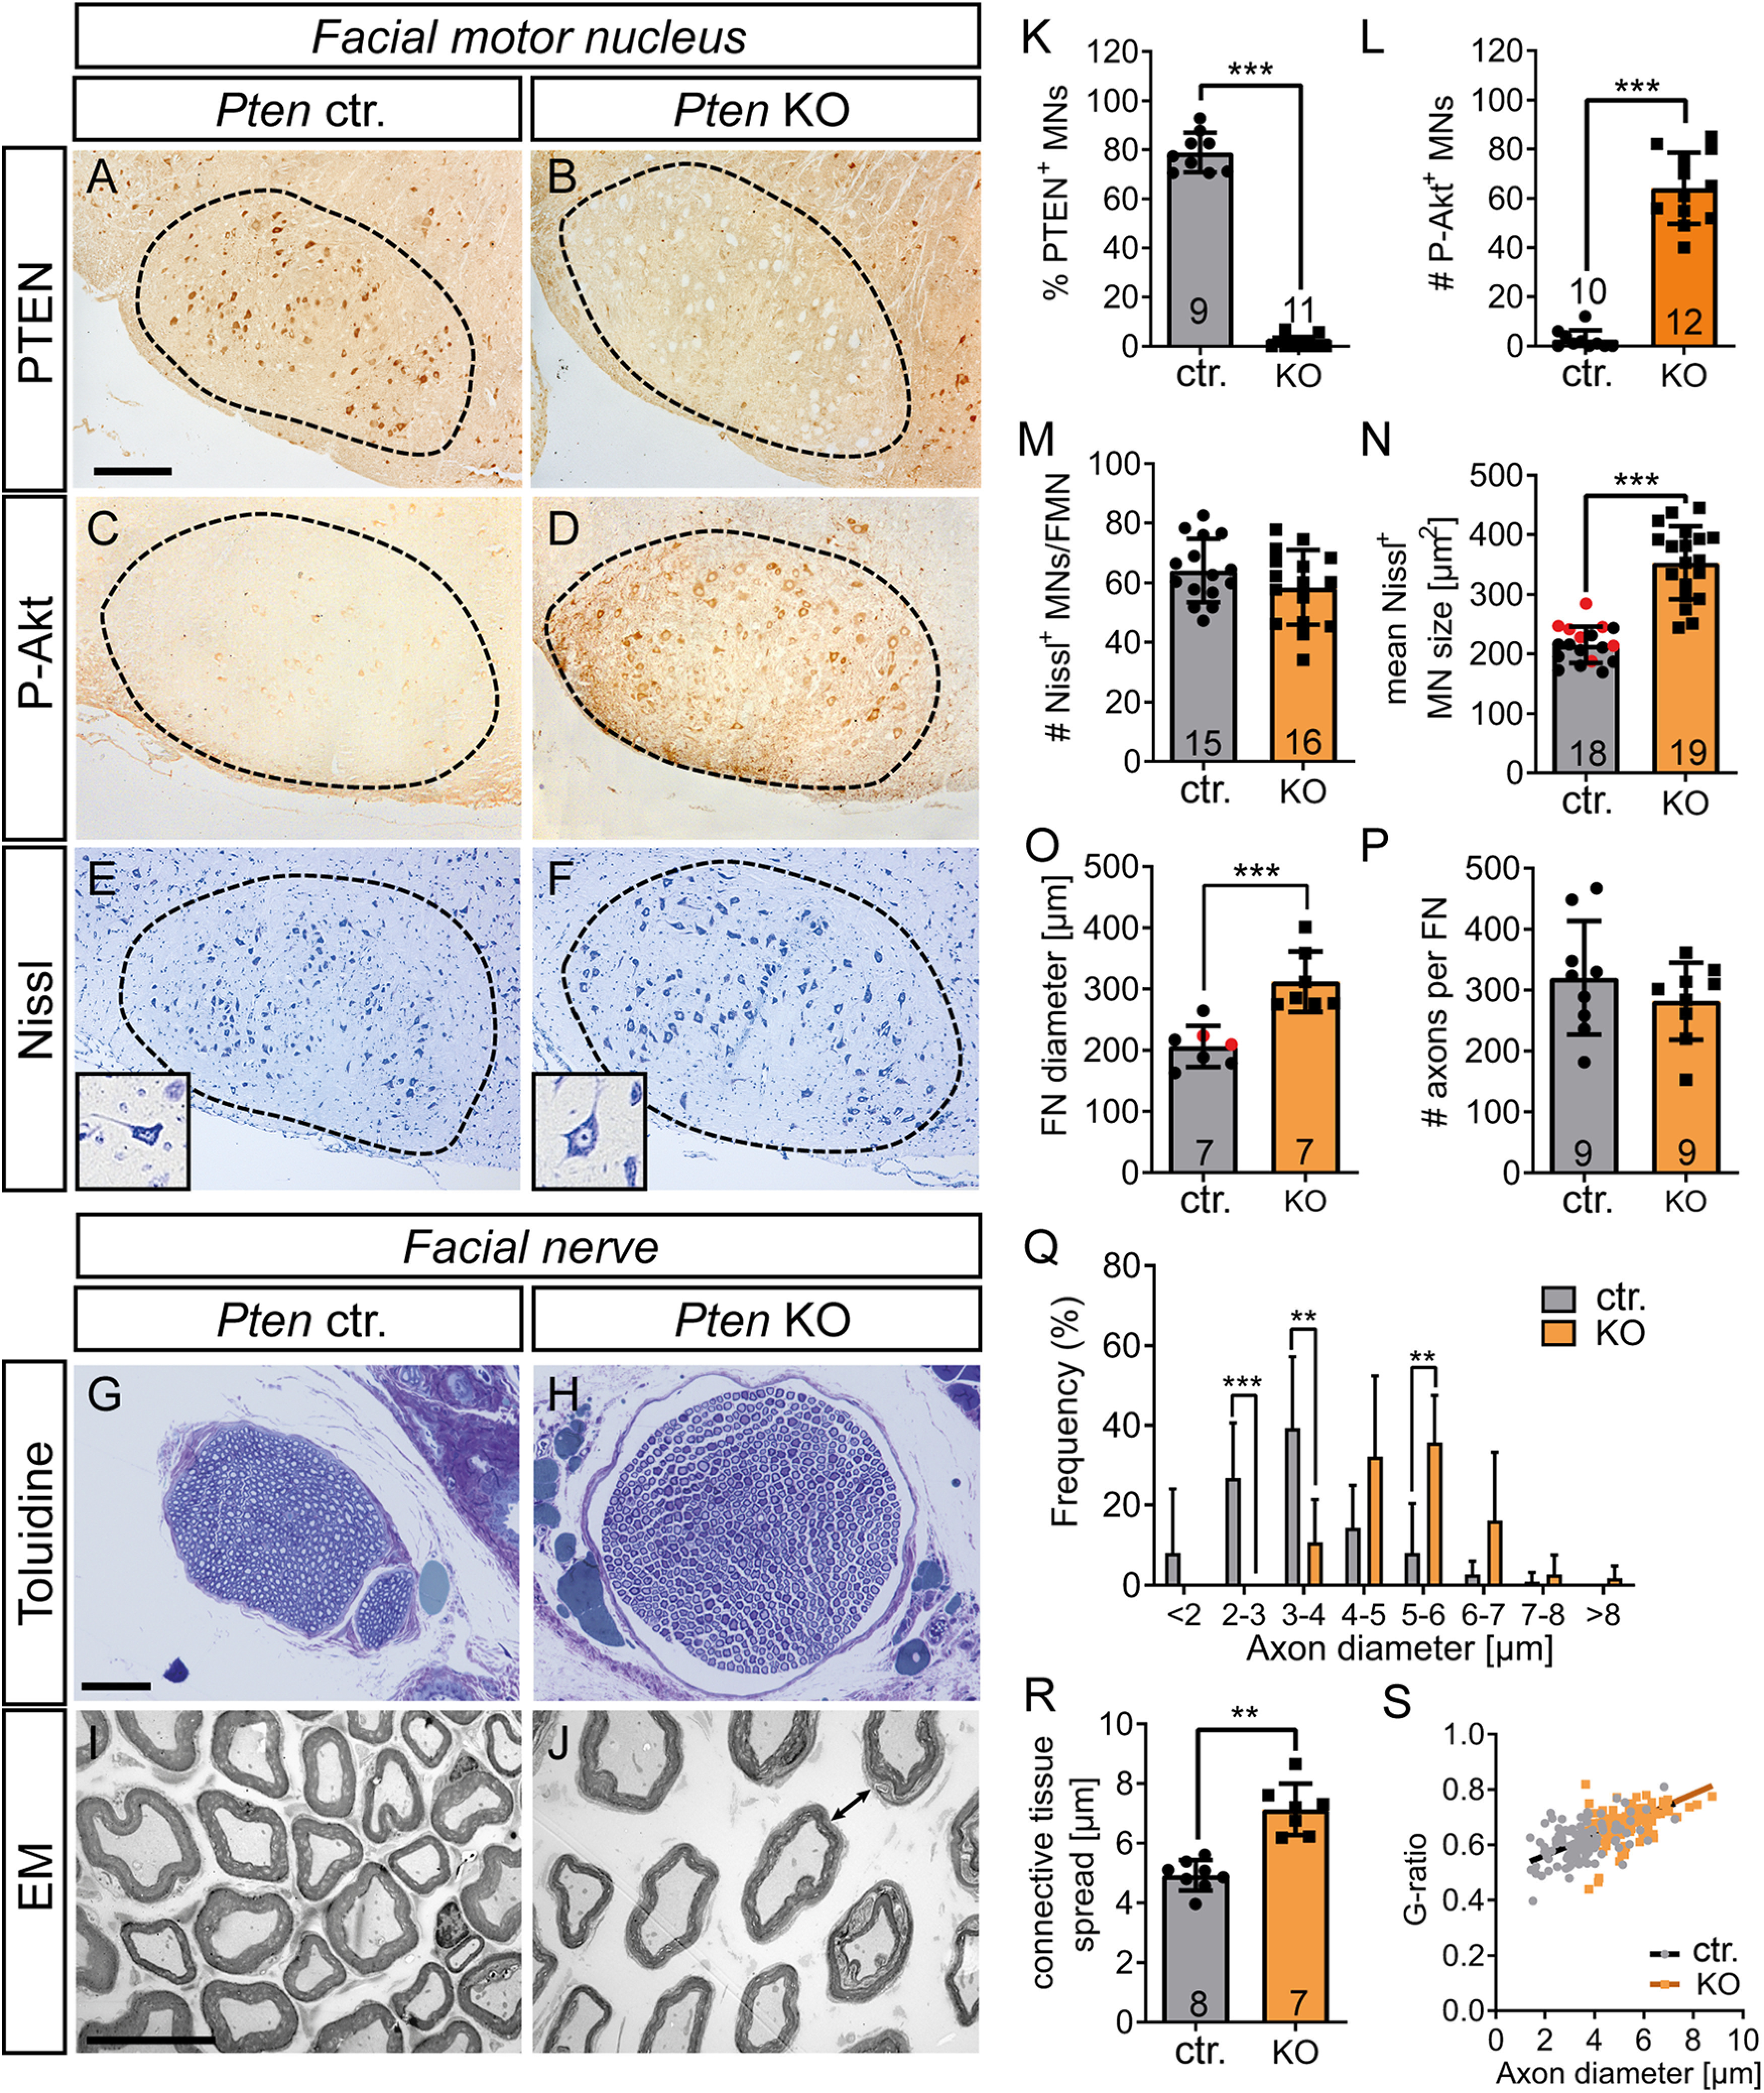
PTEN deficiency in intact MNs results in soma, axon, and nerve hypertrophy. A-F, The FMN (A-F) and FN (G-J) were stained in uninjured animals. A, B, K, Ctr. MNs expressed PTEN (A), whereas PTEN expression was absent in Pten KO neurons (B; quantified in K). C, D, L, In Ctr. mice, MNs were only weakly P-Akt positive (C). In contrast, PTEN deletion resulted in strong P-Akt induction (D; quantified in L). E, F, M, N, The size of MNs was higher in Pten KO neurons (F; see inset) compared with Ctr. neurons (E). The total MN number was not changed by PTEN ablation (M), whereas area/MN was elevated (N). N, Black dots in gray bars indicate Pten homozygous WT mice. Red dots indicate heterozygous mice. G, H, O, P, The average FN diameter stained with toluidine was higher in Pten KO (H) compared with Ctr. animals (G; quantified in O). O, Black dots in gray bars indicate Pten homozygous WT mice. Red dots indicate heterozygous mice. Axon numbers per FN remained unaltered (P). I, J, Q-S, EM pictures of Ctr. nerves (I) revealed smaller axon diameter compared with PTEN deleted animals (J). The axon diameter was plotted against the frequency for Ctr. and KO animals and showed more large-diameter axons after PTEN deletion (Q; 30 arbitrary axons for each of 7 Ctr. and 7 KO animals were analyzed). Ctr. animals also had less connective tissue between individual axons (arrow in J indicates larger distance between axons; quantified in R). The G-ratio was not altered between genotypes (S; 30 arbitrary axons for each of 7 Ctr. and 7 KO animals were analyzed). Each dot in (K-P, R) indicates 1 animal. Numbers in the bars represent numbers of animals analyzed. Data are mean ± SD. *p < 0.05; **p < 0.01; ***p < 0.001; two-sided Mann–Whitney test. Scale bars: A-F, 200 µm; G, H, 50 µm; I, J, 20 µm.
