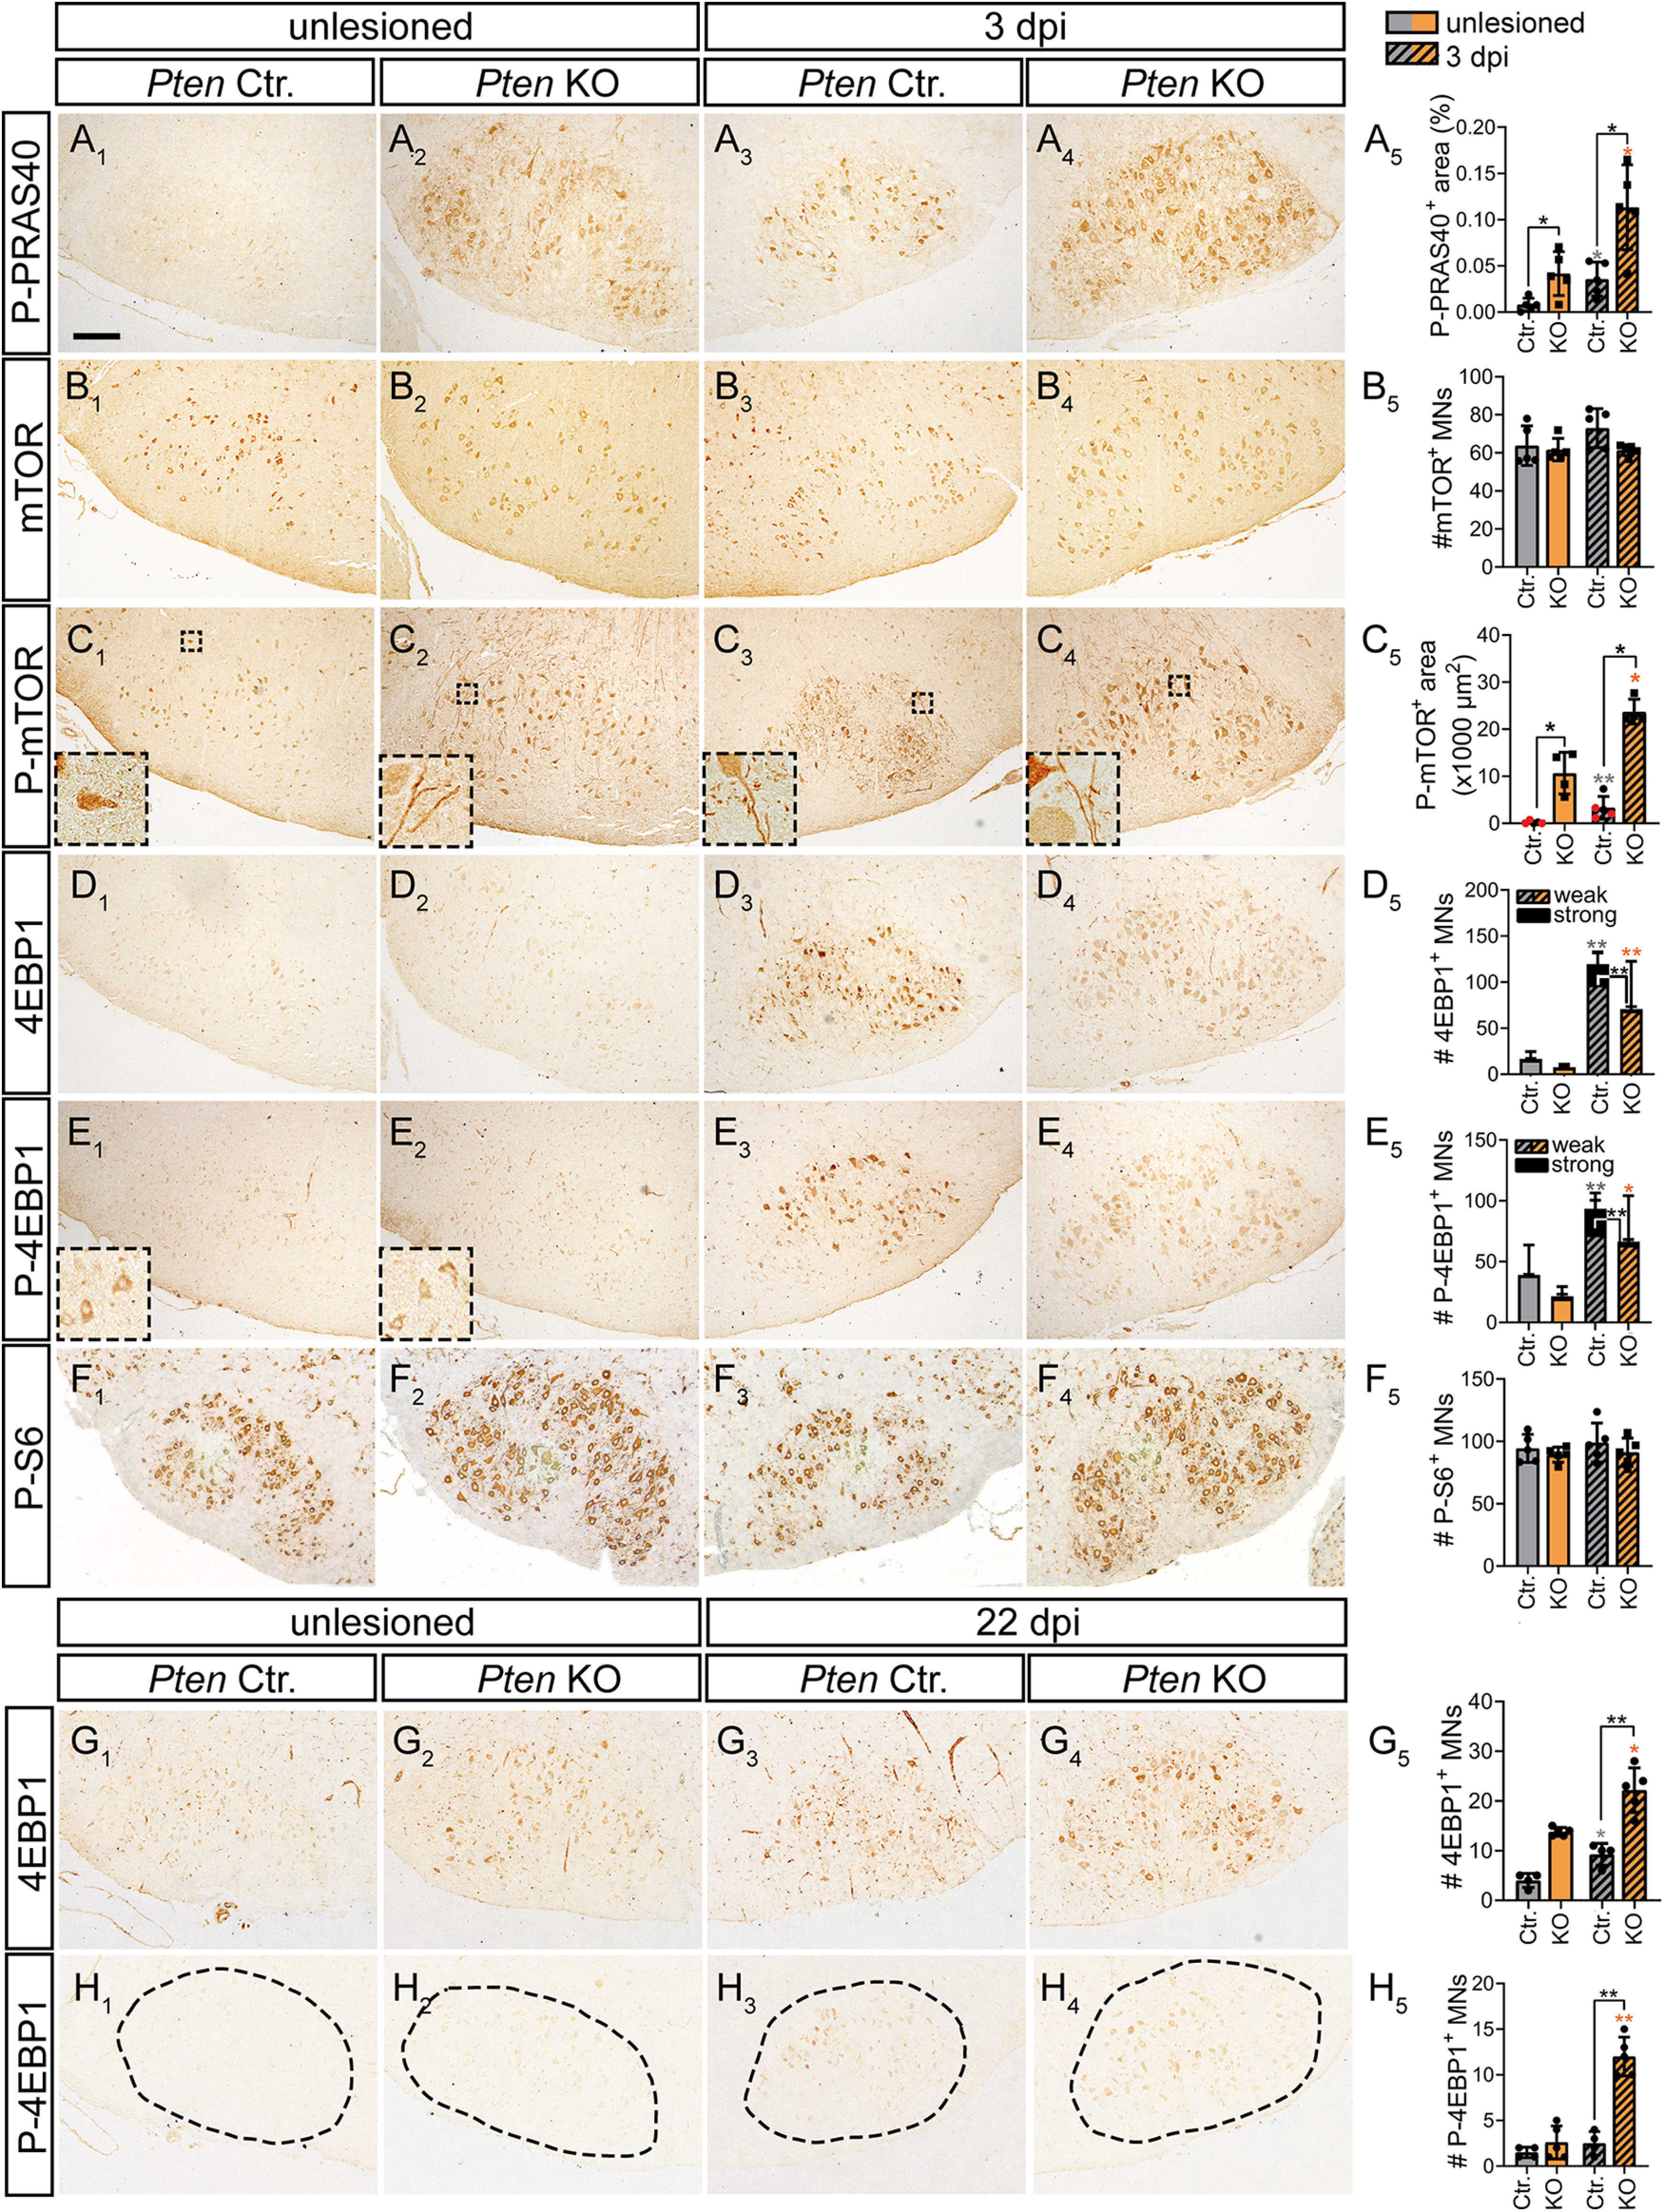
Figure 10.

Induction of a PRAS40-mTOR pathway by PTEN deletion in injured MNs. A1-A5, In unlesioned Ctr. MNs, no P-PRAS40 was visible (A1) in contrast to 3 dpi (A3). In KO neurons, P-PRAS40 abundance was higher in FMNs before (A2) and after injury (A4; quantified in A5; n = 5 for each bar). B1-B5, Total mTOR abundance was not affected by genotype or injury status at 3 dpi (quantified in B5; n = 5 for each bar). C1-C5, P-mTOR levels were slightly upregulated in injured Ctr. neurons (C3) at 3 dpi. After PTEN ablation, P-mTOR expression was elevated before (C2) and after injury (C4; quantified in C5; n = 5, 4, 5, 4 for each bar, respectively). Insets, P-mTOR localization on neuronal protrusions. C5, Black dots in gray bars indicate Pten homozygous WT mice. Red dots indicate heterozygous mice. D1-D5, At 3 dpi, total 4EBP1 abundance was higher in Ctr. (D3) compared with injured KO (D4) MNs (quantified in D5; n = 4 for each bar). E1-E5, P-4EBP1 levels were upregulated in injured Ctr. (E3) and KO (E4) neurons compared with the uninjured side (E1,E2) at 3 dpi. The number of strongly positive P-4EBP1 MNs was higher in Ctr. compared with injured KO MNs (quantified in E5; n = 4 for each bar). F1-F5, P-S6 levels were similar in unlesioned and lesioned Ctr. and KO neurons (quantified in F5; n = 5 for each bar). G1-G5, At 22 dpi, total 4EBP1 levels were elevated after FN injury in Ctr. MNs (G1,G3). In PTEN-deficient animals, 4EBP1 levels were higher both on the unlesioned (G2) and injured (G4) side (quantified in G5; n = 4, 5, 4, 5 for each bar, respectively). H1-H5, At 22 dpi, highest P-4EBP1 levels were quantified in KO animals after injury (H4). In contrast, in all other conditions (H1-H3), only weak P-4EBP1 levels were measured (H5; n = 4, 5, 4, 5 for each bar, respectively). A5, B5, C5, F5, G5, H5, Each dot indicates 1 animal. Data are mean ± SD. *p < 0.05; **p < 0.01; ***p < 0.001; two-sided Mann–Whitney test. Scale bars: A-H, 200 µm.
