Figure 2.

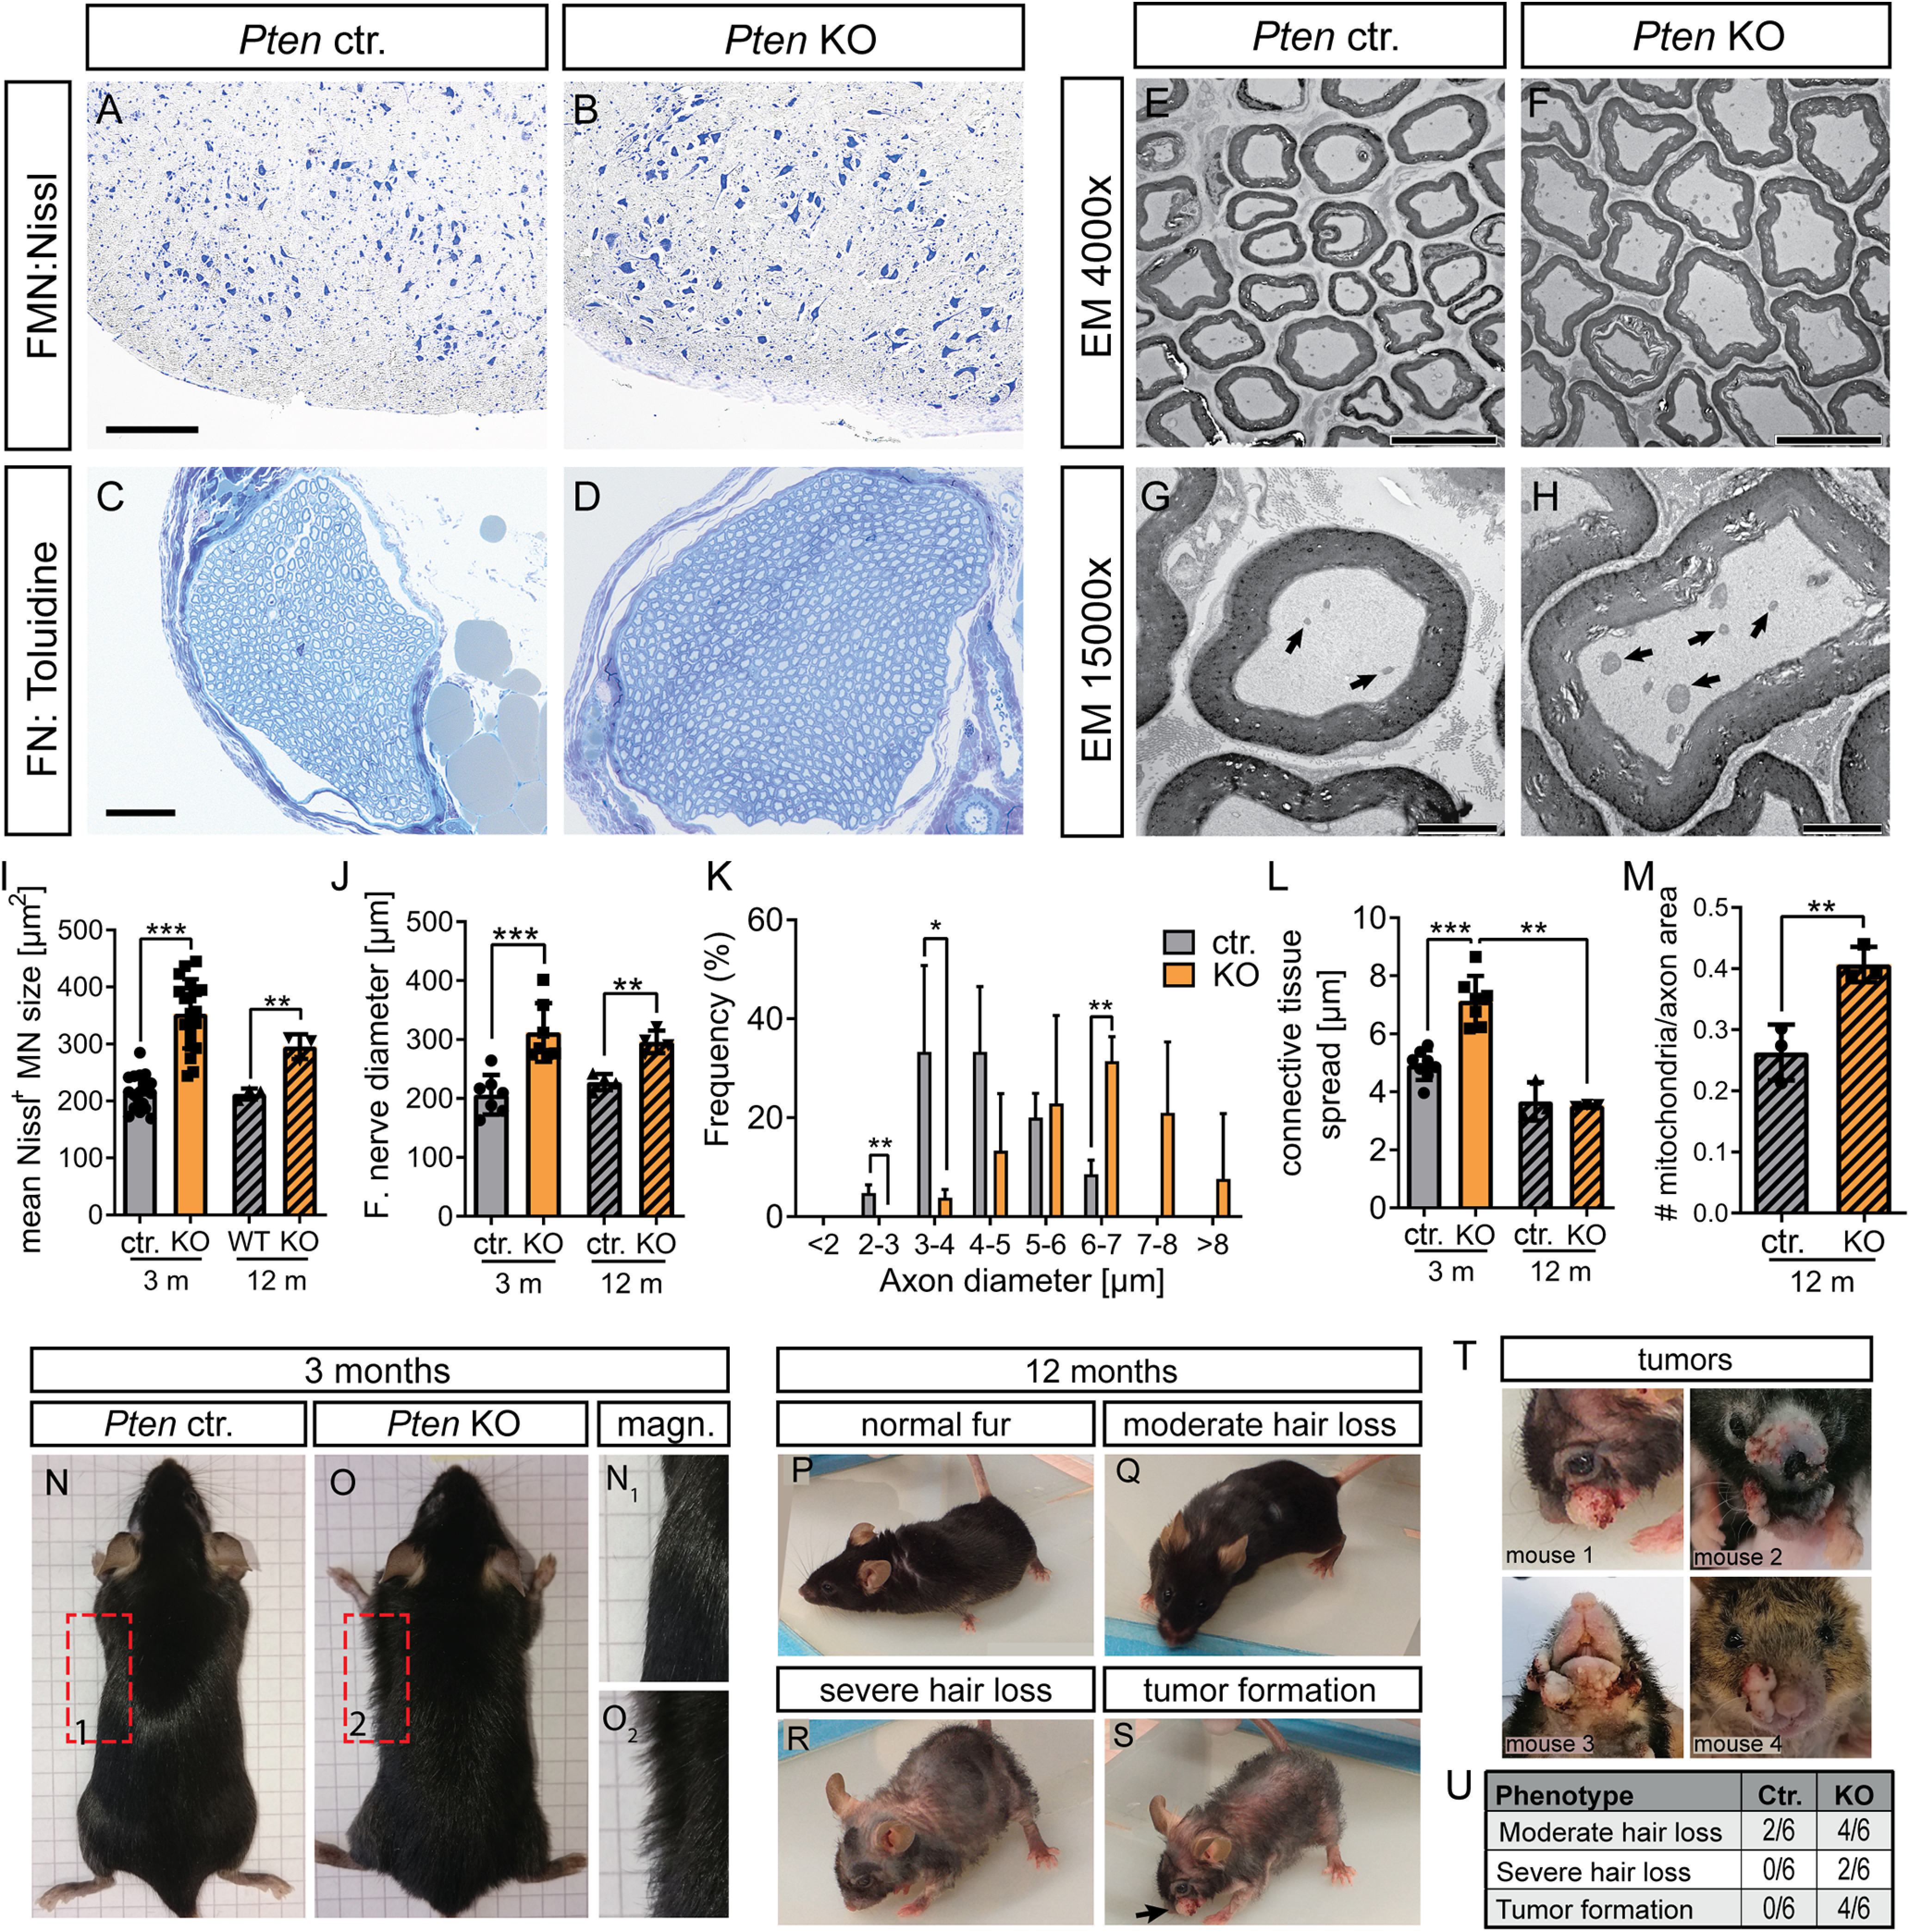
Twelve-month-old PTEN-deficient mice show MN hypertrophy and skin abnormalities. A, B, I, Nissl staining was performed in the facial nucleus of Ctr. (A) and KO (B) animals aged 10-12 months. Similar to results obtained in mice aged 3 months, the MN size was enhanced in PTEN deleted compared with Ctr. animals (I; n = 18, 19, 3, 3 for each bar, respectively). C, D, J, The nerve diameter analyzed with toluidine staining was increased in Pten KO (D) compared with Ctr (C) mice (quantified in J; n = 7, 7, 4, 4 for each bar, respectively). E-H, K-M, EM pictures at lower (E,F) and higher (G,H) magnification in the FN of Ctr. (E,G) and KO (F,H) animals at the age of 10-12 months. In PTEN-deficient animals, the diameter of individual axons was increased compared with Ctr. animals (K; n = 4 Ctr. and 4 KO animals). The connective tissue present between individual axons was elevated by PTEN ablation at 3 months of age, however not at 12 months (L; n = 8, 7, 3, 3 for each bar, respectively). The number of mitochondria present in axons was higher in KO (arrows in H) compared with axons derived from Ctr. mice (arrows in G) animals (quantified in M; n = 3 for each bar). N, O, Ctr. (N) and KO (O) mice aged 3 months are depicted. In Pten KO animals (O), a “frizzy” hair phenotype was visible, whereas in Ctr. animals, hair was smoothly aligned to the body (N). P-U, PTEN-deficient mice at the age of 10-12 months showed more severe skin phenotype (moderate to severe hair loss; see R and S) in addition to facial hyperplasia/tumor formation of the epidermis (arrow in S). T, Four different Pten KO animals are depicted showing different types and sizes of neoplasms in the facial region. Frequency of observed skin phenotype in Ctr. and Pten KO mice is shown in U. I-M, Each dot indicates 1 animal. Data are mean ± SD. *p < 0.05; **p < 0.01; ***p < 0.001; t test. Scale bars: A, B, 200 µm; C, D, 50 µm; E, F, 10 µm; G, H, 2 µm.
