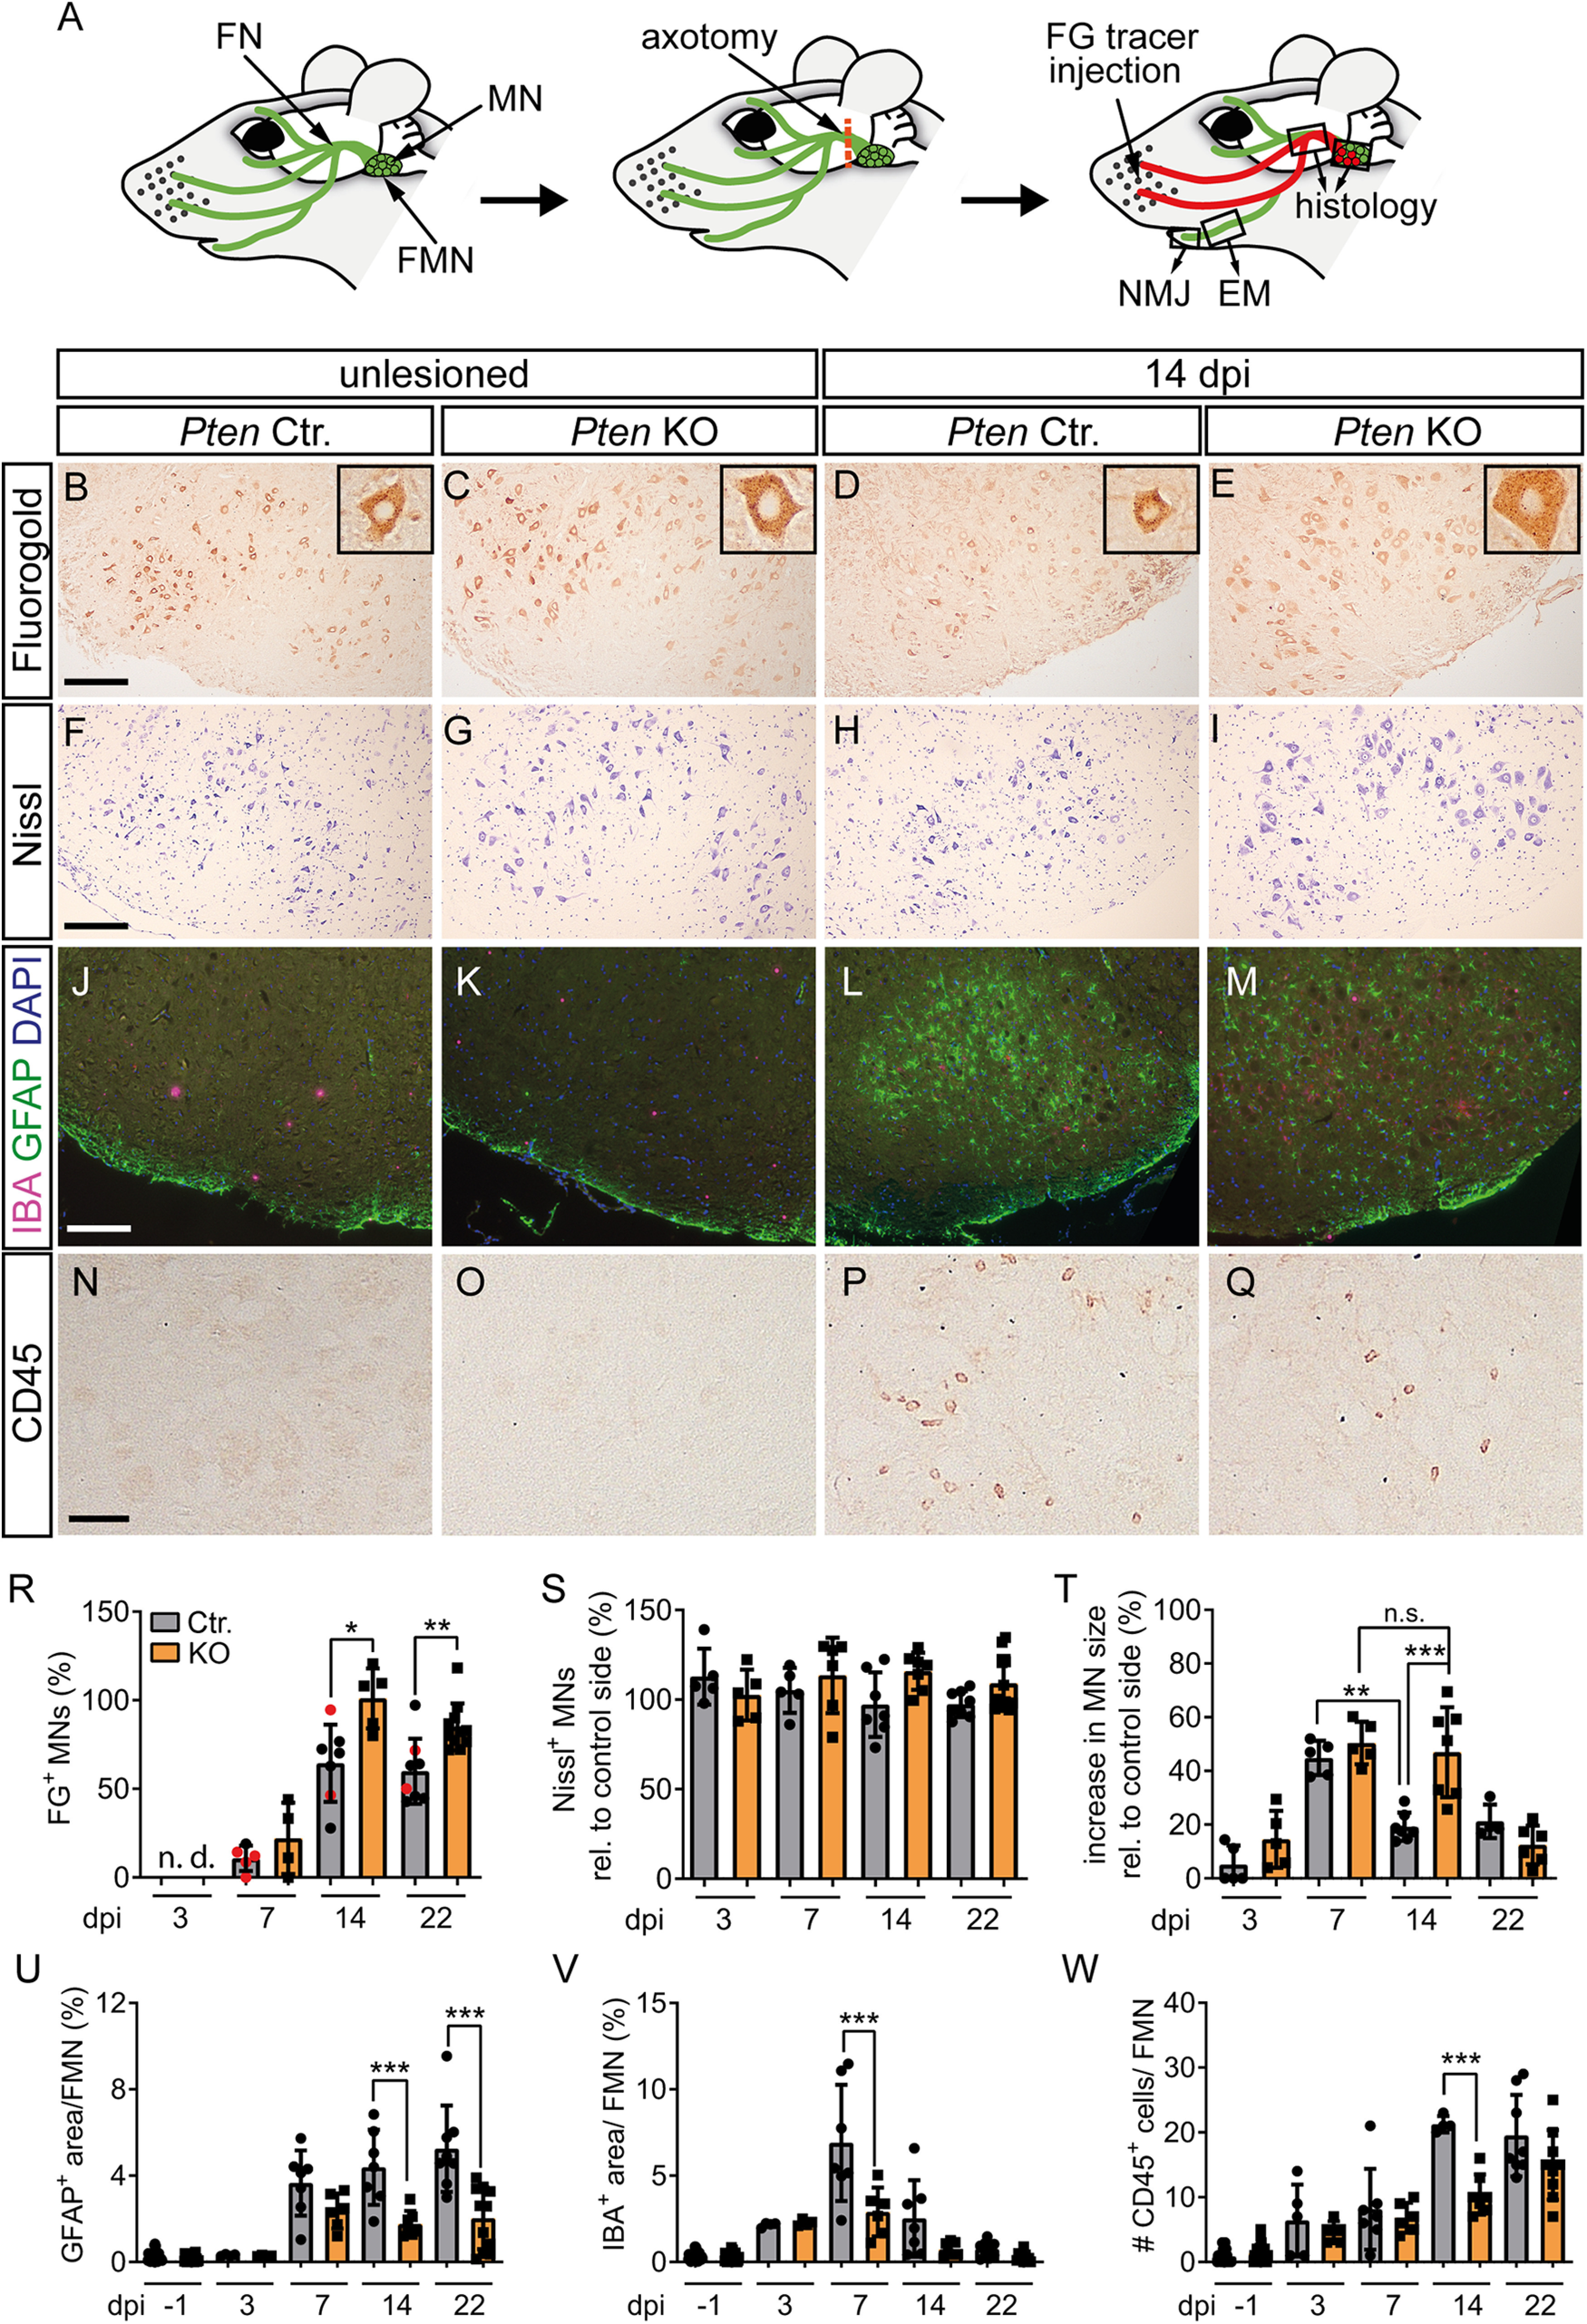
Figure 4.

PTEN deletion stimulates FN regeneration and decreases injury-associated neuroinflammation. A, Overview of the FN injury model. MNs connected to several FN branches (green; FN) are localized to the FMN in the hindbrain. Injury of the FN (red dashes line) was performed at the central branch. Upon successful regeneration, FG tracer was retrogradely transported from the whisker pad along the axons to the MNs (labeled in red). Right, Squares represent the parts of the nerve that were analyzed in histology or EM. B-E, R, The number of FG-positive neurons on the unlesioned side was identical between Ctr. (B) and KO (C) neurons. At 14 dpi, FG numbers in the Ctr. FMN (D) were lower compared with KO animals (E; quantified in R; n = 0, 0, 5, 4, 7, 5, 8, 11 for each bar, respectively). R, Black dots in gray bars indicate Pten homozygous WT mice. Red dots indicate heterozygous mice. Insets, Higher magnification of individual FG-positive neurons. F-I, S, T, The number of Nissl-positive MNs was not affected by injury or genotype (F–I; quantified in S; n = 5, 5, 5, 6, 7, 7, 8, 11 for each bar, respectively). At 14 dpi, the size of PTEN-deficient MNs was larger compared with Ctr. MNs (T; n = 5, 5, 5, 5, 7, 7, 4, 6 for each bar, respectively). J-M, U, V, In unlesioned FMN, no changes between Ctr. (J) and KO (K) were observed for astrocytes (GFAP, green) and microglia (IBA, red). In Ctr. FMN, astrocytes and microglia were increased after injury (L). In Pten KO FMN, such neuroinflammation was decreased (M; quantified in U, V; n = 27, 24, 4, 4, 7, 6, 7, 7, 8, 11 for each bar, respectively). N-Q, W, Peripheral leukocytes were labeled with anti CD45 antibody. After injury, more CD45-positive cells were visible in Ctr. (P) compared with KO (Q) animals (quantified in W; n = 21, 24, 4, 4, 7, 6, 7, 7, 8, 11 for each bar, respectively). R-W, Each dot indicates 1 animal. Data are mean ± SD. *p < 0.05; **p < 0.01; ***p < 0.001; one-way ANOVA test. Scale bars: B-M, 200 µm; N-Q, 50 µm.
