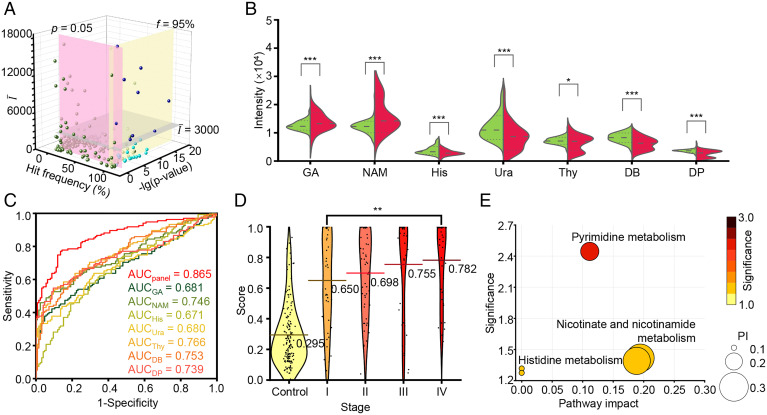
Fig. 5.
Biomarker panel construction and pathway analysis. (A) Selection of biomarker candidates according to mean intensity (), hit frequency (f), and P value (p). (B) The violin plot illustrated the differential expression of seven metabolites between the BrCa group (red) and non-BrCa group (green), and P values (***, P < 0.001; *, P < 0.05) are indicated on the Top of each violin plot. (C) The ROC curves showed a higher AUC of 0.865 using the metabolic biomarker panel than a single metabolic biomarker (AUC of 0.680 to 0.766). (D) Score distribution of individuals from the non-BrCa group (labeled as control) and BrCa patients in stage I/II/III/IV. The lines show the average scores of each group. (E) The potential pathways that were differentially regulated in the BrCa group and non-BrCa group; each circle’s color and size were correlated to the P value and pathway impact (PI). A total of three pathways were considered with a pathway impact of >0.1 and hit number ≥1, including 1) pyrimidine metabolism, 2) nicotinate and NAM metabolism, and 3) histidine metabolism.

