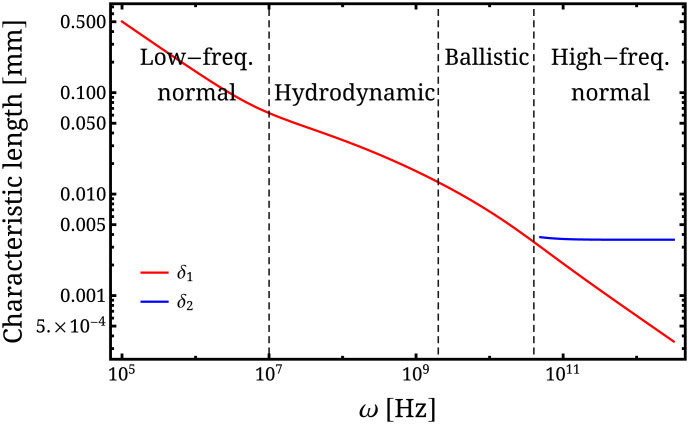
Fig. 2.
Dependence of the characteristic length scales at which a propagating electric field decays on ω. The two curves represent two solutions of Maxwell’s equations in the form of Eq. 44 supplemented by the formula for the classical conductivity Eq. 42 and experimentally realistic parameters (main text): m/s, meV, Hz, and Hz. We select only solutions satisfying and plot their characteristic decay lengths, defined as . At low frequencies there exists only one solution q1 satisfying these conditions. We can observe three transport regimes (identified as low-frequency normal, hydrodynamic, and ballistic) where δ1 shows different scaling with ω, and the cross-overs (marked with dashed black lines) happen around the values of ω for which and . Above a certain value of ω, around the point when , another solution q2 becomes relevant. Since δ2 is the longer of the two decay lengths, it dominates the propagation of the electric field and we are in what we call the high-frequency normal regime.

