Fig. 2.
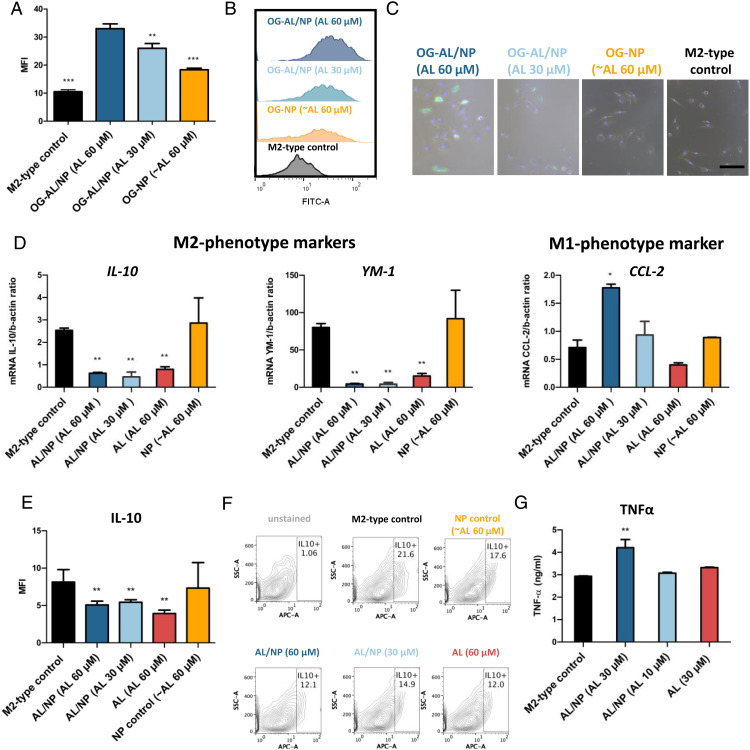
In vitro performance of AL/NPs. (A) In vitro cellular uptake by mean fluorescence intensity (MFI) of OG-AL/NPs (30 and 60 µM AL) and control particle OG-NPs (at a representative concentration of ∼60 µM AL) in M2-polarized primary macrophages (incubation time of 24 h, n = 3, **P < 0.001, ***P < 0.0001, OG-AL/NPs vs. control). (B) Histograms of representative samples of A. (C) In vitro brightfield fluorescence microscopy of M2-polarized primary macrophages incubated with OG-AL/NPs (30 and 60 µM AL), OG-NPs, and untreated M2 macrophages as control (incubation time, 24 h). (Scale bar, 100 µm.) (D) AL/NP treatment significantly reduces the transcript levels of the M2-phenotype markers IL-10 and YM-1, while the M1-phenotype marker CCL2 was increased as determined by qPCR (incubation time, 48 h; n = 3; *P < 0.05, **P < 0.001 vs. M2-type control). (E) AL/NP (30 and 60 µM AL) treatment significantly reduced IL-10 protein expression in M2-type primary macrophages as determined by flow cytometry (incubation time of 48 h, n = 3, **P < 0.001). (F) Contour plots of representative samples of E. (G) Quantification of TNFα protein levels in supernatants collected from M2-type macrophages treated with AL/NPs (30 and 10 µM AL) and controls (30 µM soluble AL or untreated) as determined by ELISA (incubation time of 48 h, n = 3, **P < 0.001).

