
Fig. 2.
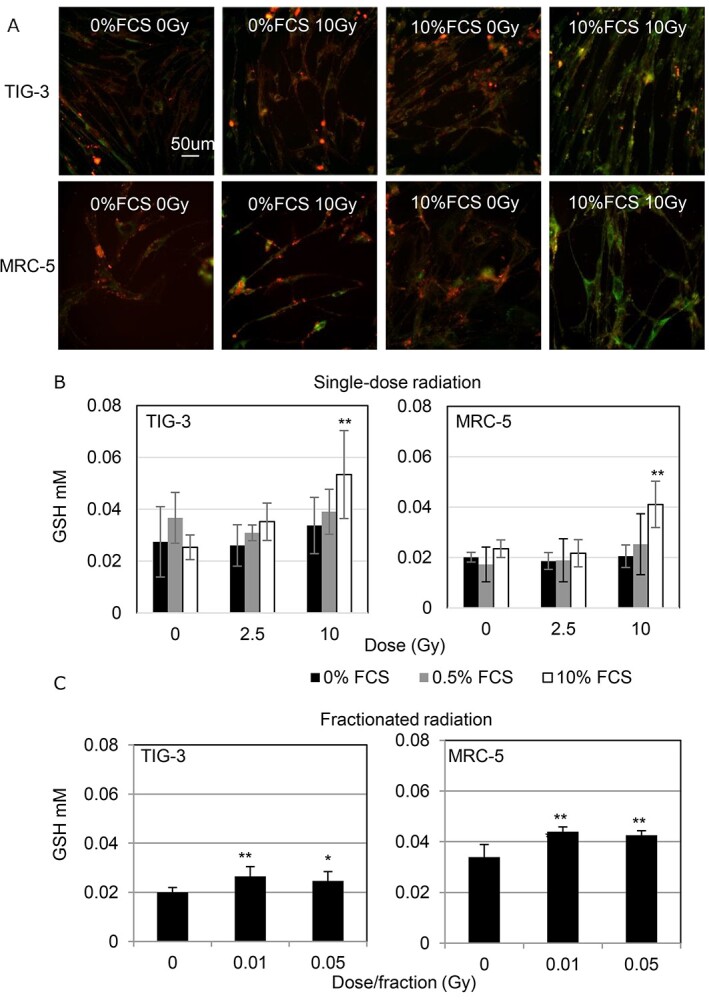
Changes in intracellular GSH levels following radiation. (A) Images of reduced GSH staining obtained using GSH quantitative-imaging probe QuicGSH in the indicated cells. Scale bar = 50 μm. Cells were examined at 24 h after irradiation. (B) GSH levels in SR cells. Asterisk indicates a significant increase in GSH levels in indicated samples compared with those in non-irradiated control cells. (C) GSH levels in FR cells. Asterisk indicates a significant increase in GSH levels compared with non-FR cells at the indicated day. *P < 0.05, **P < 0.01.