
Fig. 3.
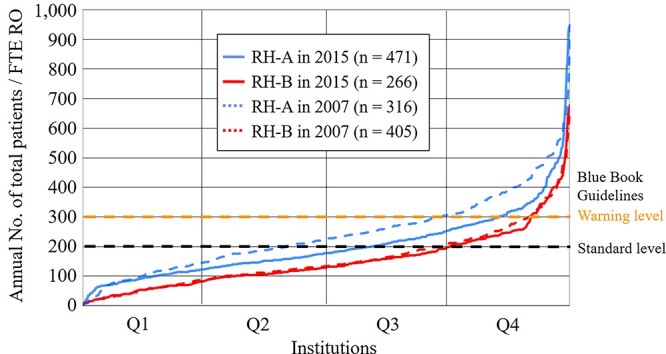
Distribution of annual total (new plus repeat) patient load per FTE RO according to institution categories shown Table 14; all radiotherapy hospitals. Horizontal axis represents institutions arranged in order of increasing value of annual number of total patients per FTE RO within the institution. Q1: 0–25%, Q2: 26–50%, Q3: 51–75%, Q4: 76–100%.