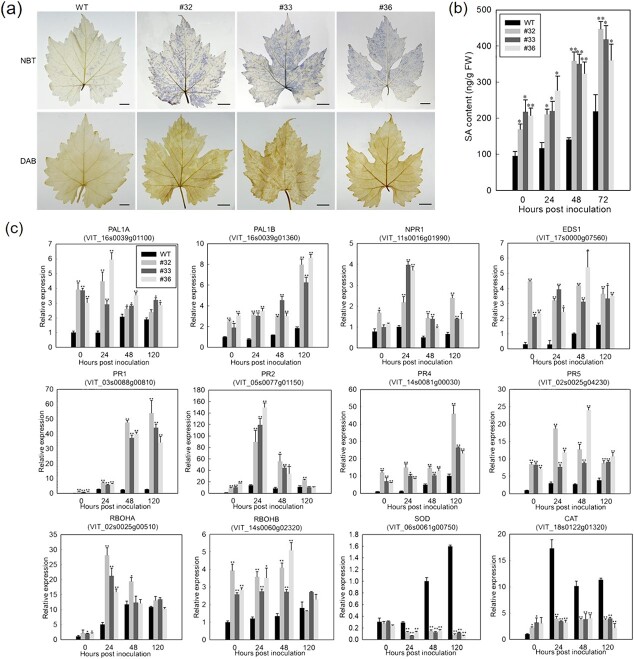
Figure 3.
Expression of VqWRKY31 increased the levels of SA and ROS. a NBT and DAB staining of leaves at 2 dpi (bar = 1 cm). b Endogenous SA content after inoculation. Data represent means ± standard errors (n = 3). Asterisks represent significant differences (*P < 0.05, **P < 0.01, Student’s t test) between VqWRKY31-expressing lines and non-transgenic control. c Relative expression of genes related to SA signaling and ROS accumulation as analyzed by qRT–PCR in leaves after inoculation. The endogenous control used was ACTIN7 (XM_002282480). Data represent means ± standard errors (n = 3). Asterisks represent significant differences (*P < 0.05, **P < 0.01, Student’s t test).

