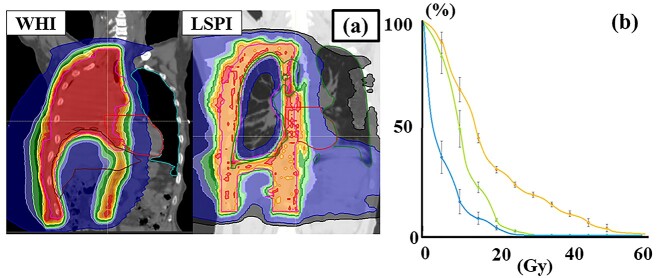
Fig. 3.
Typical dose distributions and dose volume histogram of WHI and LSPI. (a) Dose distributions of WHI and LSPI plans. (b) The yellow line is a dose volume histogram of the lung in LSPI plans, green is that of the contralateral lung in LSPI and light blue is that of the contralateral lung with WHI. Each line shows the average dose of each plan. Bars show standard errors at the dose point.

