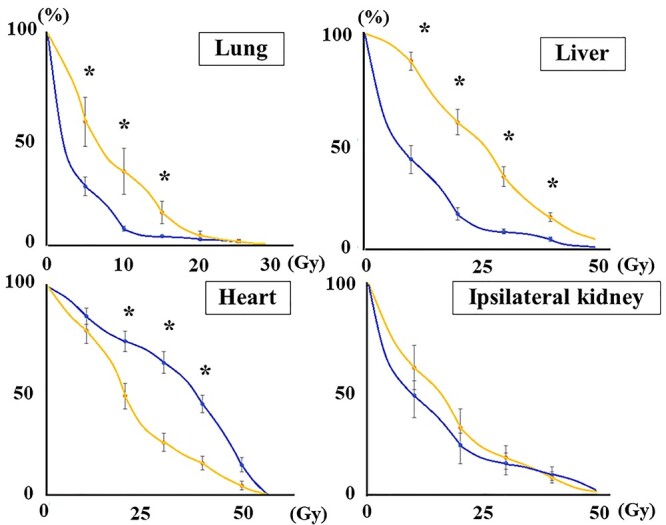
Fig. 4.

Dose volume histogram of WHI. Blue lines represent the average dose volume histogram in patients with left-side tumors, and yellow lines for those with right-side tumors. Bars show standard errors at the dose point. * indicates a significant difference between the right and left sides.
