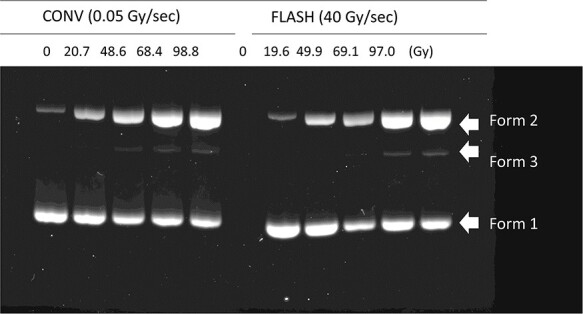
Fig. 1.

Representative image of agarose gel electrophoresis. CONV and FLASH irradiated pBR322 plasmid DNA in solution were electrophoresed and were isolate according to their molecular forms. Induction rate (NSSB and NDSB per Gy) analyzed from the shown gel image were, 9.7 × 10⁻³ (NSSB/molecule/Gy) and 9.4 × 10⁻⁵ (NDSB/Gy) for CONV and 8.8 × 10⁻³ (NSSB/ molecule/Gy) and 9.5 × 10⁻⁵ (NDSB/ molecule/Gy) for FLASH, respectively. Fluorescence values of each band detected in the lanes are indicated in supplemented Table S1.
