Fig. 2.

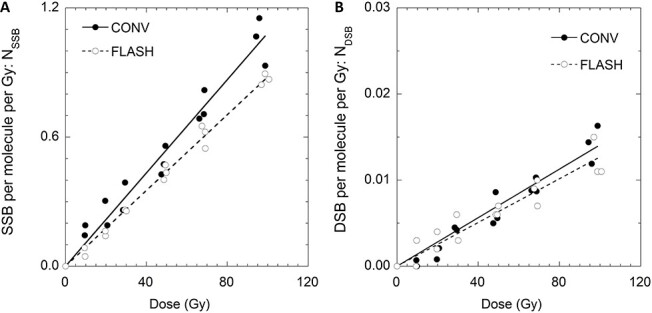
Number of SSB (NSSB, Panel A) and DSB (NDSB, Panel B) and per plasmid irradiated at CONV and FLASH dose rate as a function of absorbed dose in Gy. The solid lines are the fit obtained by linear regression of the experimental data.

Number of SSB (NSSB, Panel A) and DSB (NDSB, Panel B) and per plasmid irradiated at CONV and FLASH dose rate as a function of absorbed dose in Gy. The solid lines are the fit obtained by linear regression of the experimental data.