Figure 1.
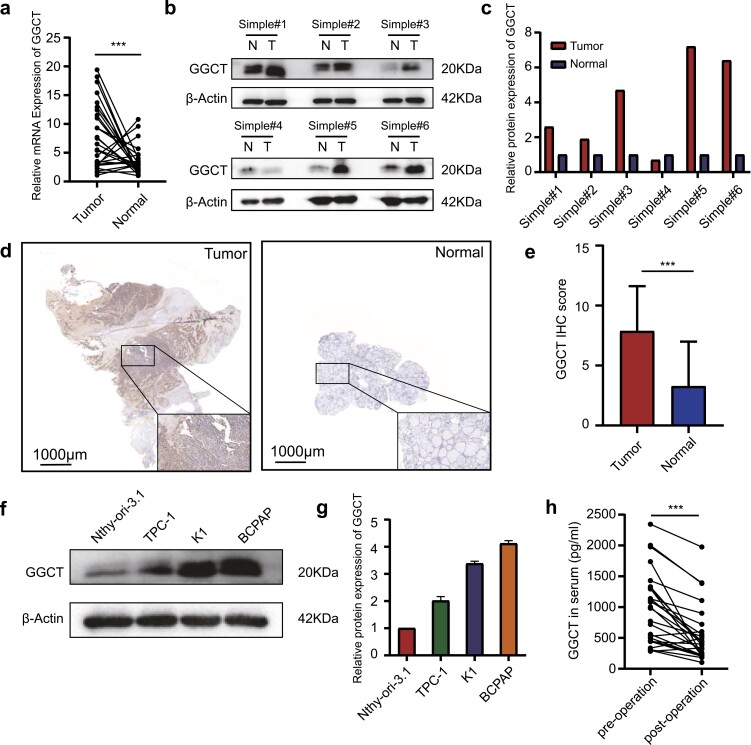
GGCT is overexpressed in PTC. (a) Scatter dot plots with connecting lines show the mRNA expression of GGCT in paired PTC and normal thyroid tissues (n = 27). (b) Western blot (WB) experiments show the protein expression of GGCT in 6 paired normal and tumor samples. (c) The quantifications of WB signal in each patient were normalized to β-actin and presented as histograms. (d) Representative images of immunohistochemistry (IHC) of GGCT in the normal thyroid tissues (right) and PTC tissues (left) (magnification, ×100, scar bar = 1000 μm). Solid black boxes indicate higher magnifications (×400) of the areas. (e) IHC scores of GGCT were calculated in PTC group (n = 178) and normal thyroid group (n = 82). GGCT protein levels in PTC and normal thyroid cell lines were assessed by WB (f) and quantified (g). (h) The level of secreted GGCT in patient’s serum before and 24 hours after surgical intervention was determined by ELISA assays (n = 26). The line connecting the 2 scatters denotes the change in GGCT secretion of the same patient before and after surgery. ***: P < 0.001.

