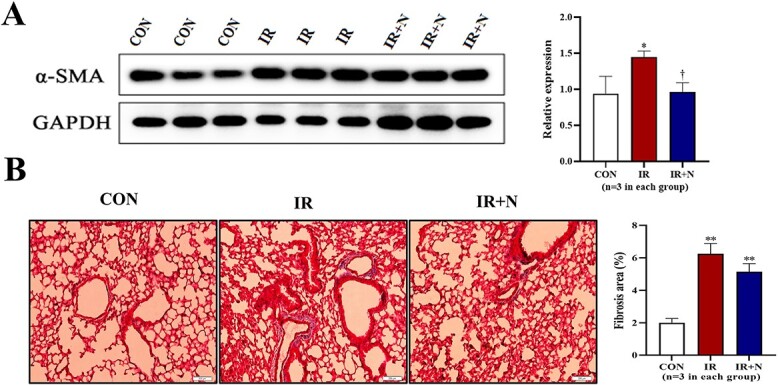
Fig. 4.

The fibrotic changes in lungs at the chronic phase after treatments. (A) Representative blots (left) and quantitative data (right) on the expression of α-SMA in lungs are shown. (B) Representative images (left) and quantitative data (right) of Masson‘s trichrome staining on the fibrotic area in lungs are shown. Scale bars: 200 μm. Data are represented as means ± SD. *p < 0.05, **p < 0.01 vs CON group, †p < 0.05 vs IR group. CON: Control, IR: Radiation, IR + N: Radiation+Nicaraven.
