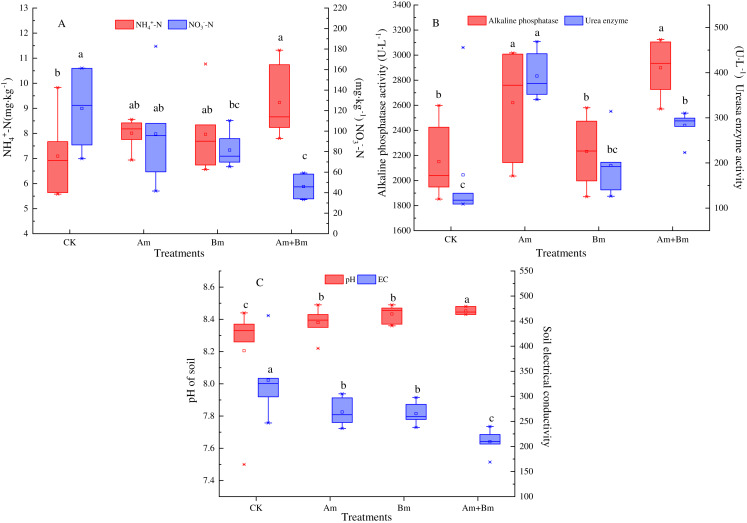
Figure 2. Effect of different inoculations on the soil ammonium nitrogen and nitrate nitrogen content (A), alkaline phosphatase and urea enzyme (B), and pH and electrical conductivity (C).
Different letters represent significant differences at P = 0.05 using one-way ANOVA. The error bars in the figure legends represent the standard deviation. CK, no inoculation; (Am), only AMF inoculation; Bm, only Bacillus inoculation; Am + Bm, both symbionts.

