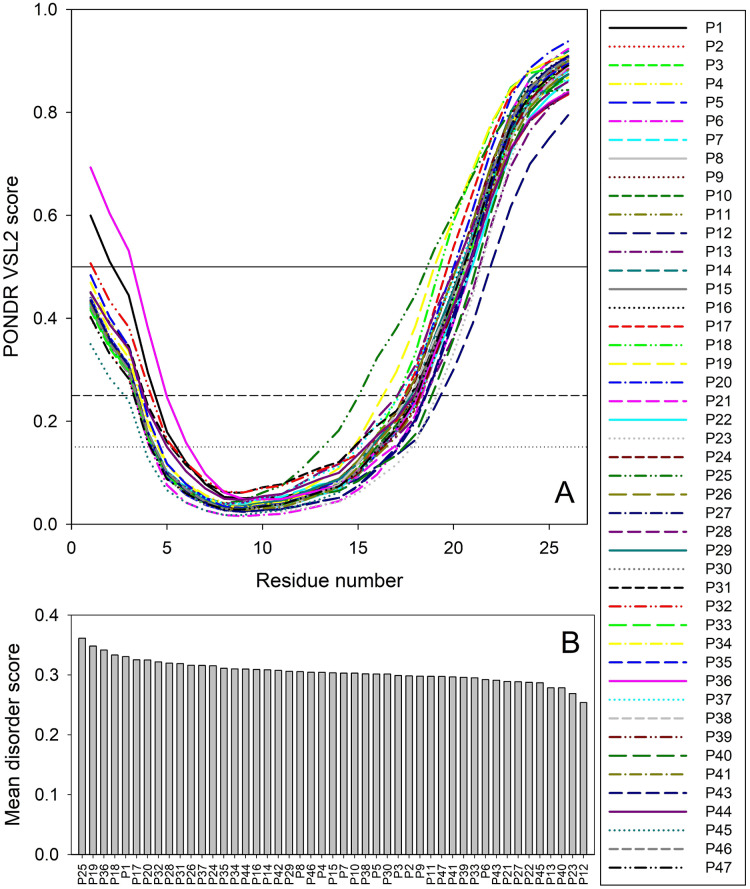
Figure 2. Analysis of intrinsic disorder predisposition of 47 T-ORF8 proteins.
(A) Disorder profiles generated using the PONDR-VSL2 disorder predictor. Three thresholds of predicted disorder scores (PDSs) are shown, 0.15, 0.25, and 0.5, which are used for the classification of protein residues as highly disordered (PDS ≥ 0.5), flexible (0.25 ≤ PDS < 0.5), moderately flexible (0.15 ≤ PDS < 0.25) and mostly ordered (PDS < 0.15). B. Ranking of 47 T-ORF8 proteins based on their mean disorder scores.

