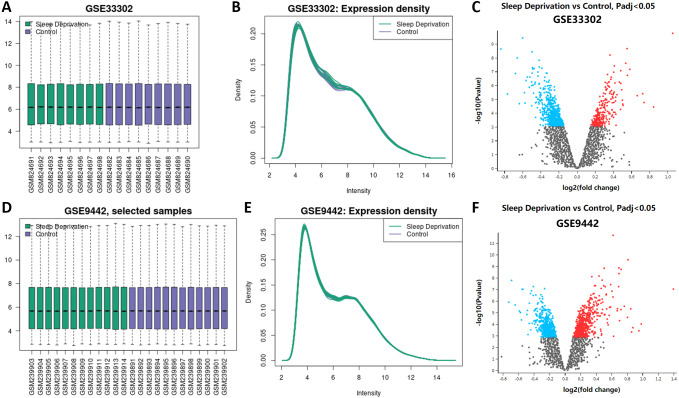
Figure 1. Expression of genes between sleep deprivation and control.
(A) Boxplots of GSE33302. Samples from the sleep deprivation group are colored green and the ones from the control group are colored purple. (B) The density map of GSE33302 shows the expression of each sample. (C) The volcano map shows DEGs in GSE33302. The up-regulated genes are colored red and the down-regulated genes are colored blue. (D) Boxplots of GSE9442. (E) The density map of GSE9442. (F) The volcano map of DEGs in GSE9442. DEGs, differentially expressed genes.

