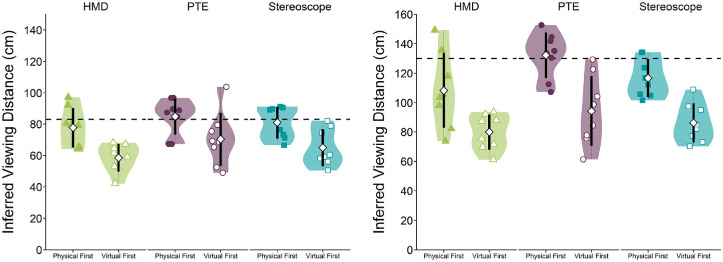
Figure 7.
Inferred viewing distance estimates for each apparatus: HMD (triangles), PTE (circles), and stereoscope (squares), for the near (left plot) and far viewing distances (right plot), for the physical-first and virtual-first observers (filled and open symbols, respectively). The dashed line represents the viewing distance to the reference frame in the near and far conditions (83 cm and 130 cm, respectively). The white diamond represents the mean and the black rectangle represents the standard error of the mean. The shaded distribution represents a density estimation that was fit using a Gaussian kernel with a smoothing bandwidth using Silverman's rule-of-thumb (or 0.9 times the minimum standard deviation and interquartile range divided by 1.34 times the sample size to the negative one-fifth power). This density estimation is plotted twice, once on each side of the boxplot for each condition.

