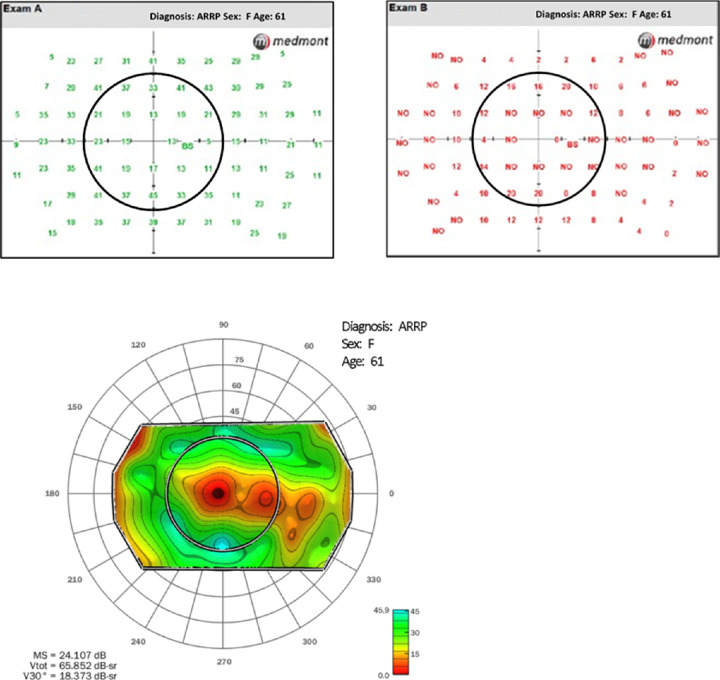
Figure 2.
Derivation of rod visual fields in a participant with ARRP. Fields were obtained twice, once with a cyan test and once with a red test (a). Not seen points are indicated with NO. Locations where the cyan-red difference was greater than 5 dB were considered rod mediated. Topographic analysis of cyan values for all rod-mediated locations was provided by visual field modeling and analysis (b).

