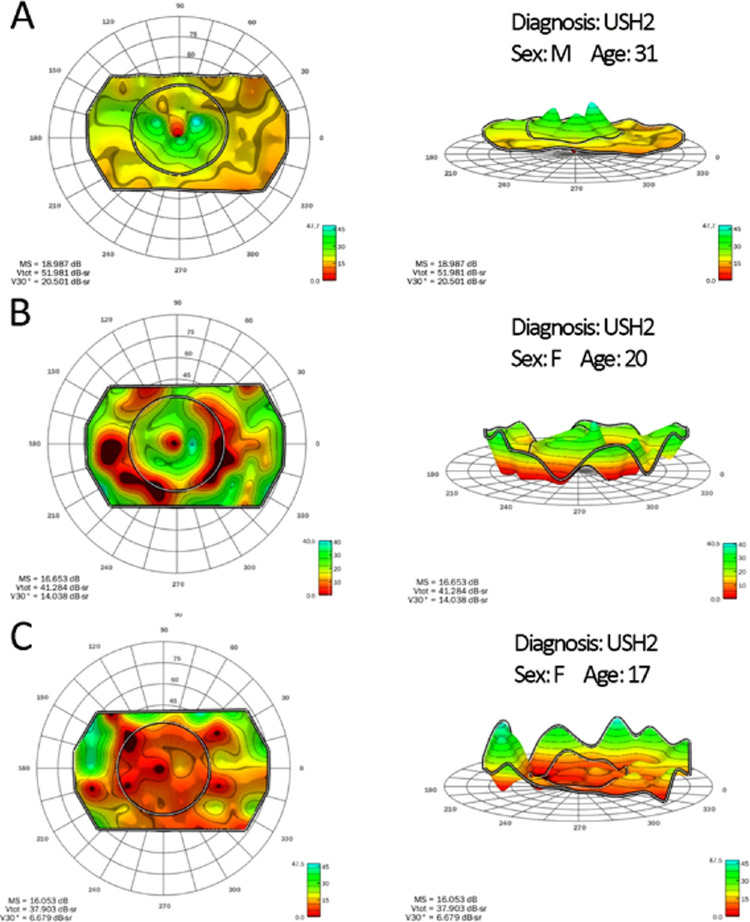
Figure 3.
Representative rod visual fields, with top-down views shown in the left column and side views shown in the right column. Row A shows a participant with preserved rod function in the central 30°. Row B shows a participant with a deep mid peripheral scotoma, and row C shows a participant with only residual rod function in the far periphery.

